API Performance Testing - Tools & Metrics
API performance testing ensures your APIs are fast, reliable, and scalable. It's critical for identifying bottlenecks, improving user experience, and maintaining system stability. Here's what you need to know:
Key Metrics: Focus on response time, throughput, error rates, and resource usage to evaluate API performance.
Main Tools: Popular options include Postman (user-friendly), JMeter (flexible load testing), K6 (JavaScript-based), and Qodex (AI-driven automation).
Testing Methods: Use structured approaches like load testing, error tracking, and real-time performance monitoring to simulate real-world conditions and pinpoint issues.
Business Impact: Effective API testing boosts reliability, reduces downtime, and ensures scalability for growing user demands.
Quick Comparison of Tools:

Key takeaways:
Every tool here supports both load and stress testing.
CI/CD pipeline compatibility is standard across the board.
Each tool provides actionable reports for performance insights.
If budget is a concern, JMeter and Locust.io stand out as free choices.
Start by defining performance goals, selecting the right tools, and embedding tests into your CI/CD pipeline for continuous improvement.
Why Regular API Testing Matters
Using a robust API testing tool regularly helps you:
Find and fix problems early before users are impacted
Improve the overall performance and scalability of your API
Proactively maintain a seamless user experience, even under heavy load
The best tool is the one that fits your team’s needs and budget. More important than the specific tool, however, is making regular testing a habit. Frequent and structured testing ensures your API stays healthy as usage grows and requirements change.
Free vs Paid API Performance Testing Tools
When choosing an API performance testing tool, cost is often just as important as features. Here’s a quick rundown to help you decide:
Free & Open-Source Tools:
For teams on a tight budget or those who love open-source flexibility, options like JMeter and Locust.io offer robust performance testing without the price tag. These tools cover core functionality, including load and stress testing, and integrate smoothly into CI/CD workflows.Freemium Choices:
Some tools, such as Postman, provide both free and paid tiers. The free version supports essential testing and reporting for individuals or small teams, while advanced features, like more detailed analytics or additional integrations, require a paid upgrade. This balance lets you scale testing as your needs grow.Premium, Feature-Rich Solutions:
For larger teams or enterprises needing advanced features, consider paid solutions like SoapUI, LoadRunner, K6, Gatling, LoadNinja, LoadView, and Loader.io. These tools typically offer enhanced reporting, scalability, and support, making them a fit for more demanding or complex scenarios.
Summary Table
Tool Category Examples Cost Free & Open Source JMeter, Locust.io Free Freemium Postman Free/Paid Premium/Paid SoapUI, LoadRunner, K6, Gatling, etc. Paid Selecting between free, freemium, and paid tools comes down to your team’s budget, scale of testing, and the level of features and support required. Start with what fits your current needs, it's easy to adjust as your project grows.
Getting started with API Load Testing (Stress, Spike, Load, Soak)
API Performance Metrics
Tracking API performance metrics is key to ensuring smooth functionality and maintaining service quality. These metrics help teams set service level objectives (SLOs) and deliver consistent performance.
Response Time Measurement
Response time measures how quickly an API processes a request and sends back a response. It’s a critical factor in user experience.

Looking at percentiles, like the 95th or 99th, instead of averages can uncover outliers that skew overall performance. Alerts based on these percentiles help catch anomalies that might otherwise go unnoticed.
Request Load Handling
Throughput measures how many requests an API successfully processes in a given time. This metric highlights how well the system handles concurrent demands.
Drops in throughput can signal system issues, while unexpected spikes might indicate unauthorized bot activity. Establishing a baseline and setting alerts for deviations ensures you can respond quickly to unusual patterns.
Error and Success Tracking
Tracking errors is crucial for understanding and resolving issues. Here are some key practices:
Set error thresholds based on business needs.
Focus on 5xx errors, which indicate server-side problems.
Identify recurring error patterns for proactive fixes.
Use automated alerts for critical errors.
For instance, fault-tolerant systems like search APIs might allow an error rate of 0.01%. However, APIs handling financial transactions require stricter thresholds, such as alerts for 10 errors per minute.
When combined with end-to-end monitoring, these metrics create a strong foundation for improving API performance and reliability.
Why API Performance Reports Matter
Readable reports from your API performance tests tell you exactly how your system is holding up when demand spikes:
What it shows Why it’s helpful How fast your system responds Pinpoints bottlenecks and slow endpoints How many errors occur Reveals fragile or failing components Request capacity under load Shows whether your API can scale gracefully By reviewing these reports, teams can quickly identify slow spots, error-prone paths, and capacity limits, so you can optimize your system before users feel the pain.
Whether you’re testing a website, mobile app, or any API, these insights help ensure a smooth, responsive experience for everyone, even under heavy traffic.
API Testing Tools
Open-Source vs. Paid API Testing Tools: Pros and Cons
Selecting between open-source and paid API testing tools comes down to your team’s priorities, workflow, and resources. Each approach has unique strengths worth considering.
Open-Source Tools: Why Choose Them?
Open-source tools stand out for their flexibility and cost savings:
Zero Licensing Costs: Use and customize them freely, making them ideal for teams with limited budgets or those just getting started.
Broad Community Support: Popular open-source options attract active user communities. This means abundant documentation, plugins, and community-driven troubleshooting.
Customization and Extensibility: With access to source code, teams can tailor tools to fit unique workflows or integrate with custom dev stacks.
However, there are some caveats:
Setup and Maintenance: Expect a steeper learning curve and more hands-on setup.
Support Limitations: Rely mainly on community forums or GitHub issues when challenges arise, which might slow down troubleshooting.
Paid Tools: Where They Shine
Paid solutions deliver advanced features and dedicated support, aiming to boost productivity:
Streamlined User Experience: Paid options often come with polished interfaces, guided onboarding, and built-in integrations, speeding up both adoption and daily use.
Advanced Functionality: Expect extras like in-depth analytics, team collaboration, real-time dashboards, and enterprise-level security.
Professional Support: Vendors typically offer responsive customer service, training, and regular feature updates to keep pace with evolving testing needs.
Keep in mind:
Cost Considerations: Licenses and subscriptions add up, especially for larger teams or those scaling up usage.
Vendor Lock-In: Customization is limited to what the provider allows, which can hinder highly specialized use cases.
How to Decide
Assess Your Team’s Needs: Do you value flexibility and have technical expertise? Open-source might fit you. Prefer plug-and-play simplicity or need enterprise-grade support? Paid tools win out.
Consider Your Budget and Resources: Factor in not just upfront costs, but also the time and skills required to maintain and extend your chosen solution.
Ultimately, the best API testing tool is the one that aligns with your technical goals, team skills, and plans for growth. Pairing the right tool with regular testing routines helps you catch issues early, improve reliability, and keep users satisfied.
Postman

Postman is known for its user-friendly interface and support for running multiple requests simultaneously, making it great for team-based API testing.
Highlights include:
Running multiple requests in parallel to simulate load
A shared testing environment for teams
JMeter

Apache JMeter is a cross-platform tool built entirely in Java, making it a flexible choice for testing APIs like RESTful and SOAP web services.
"Use JMeter's GUI only for test creation and debugging; run load tests in non-GUI mode. For optimal performance during high-load tests, remember to remove or disable the View Results Tree listener, as it can otherwise consume significant resources and slow down your load generator."
Extracting Response Data with JMeter
When you need to capture specific values from an API response in JMeter, like a returned deck_id, the Regular Expression Extractor comes in handy.
Here’s how to set it up:
Add the Regular Expression Extractor:
Attach a Regular Expression Extractor to the HTTP Request sampler you want to evaluate.Define the Extraction Pattern:
In the extractor's settings, use a regular expression that matches the field you’re after. For example, to grabdeck_idfrom a JSON response:This pattern captures whatever follows
"deck_id": "and stores it for use in subsequent requests or assertions.Configure Field Names:
Reference Name: Choose a variable name, like
deck_id, for use later in your test.Template: Typically
$1$to refer to the first captured group.Default Value: What JMeter should use if it doesn’t find the pattern.
Use the Extracted Variable:
Reference${deck_id}wherever you need it, such as in headers, request bodies, or assertions in later steps.
Tip: For optimal performance, especially during high-load testing, disable or remove the View Results Tree listener. This keeps JMeter running smoothly while collecting the data you need.
A JMeter load test typically includes the following:
Test Plan Setup: Begin by launching JMeter and creating a new Test Plan. Right-click on the Test Plan to add a Thread Group (representing virtual users).
Adding Requests: Within the Thread Group, add HTTP Request samplers to define the API endpoints you want to test.
Parameterization: You can customize each request with parameters, headers, and payloads as needed.
Extracting Data: To extract values from API responses, such as
deck_idfrom a JSON response, add a Regular Expression Extractor. For example, use the pattern"deck_id":\s"(.*)"to capture the value.Assertions: Add assertions to verify expected responses and ensure your API behaves as intended.
Running the Test: For best performance during high-load scenarios, disable or remove the View Results Tree listener to reduce resource usage.
Execution Modes: While the GUI is ideal for test creation and debugging, always run your actual load tests in non-GUI (command-line) mode to maximize throughput.
JMeter’s flexibility and detailed reporting make it a favorite for both quick checks and comprehensive API performance testing.
Getting Started with API Testing in JMeter
JMeter runs on any platform that supports Java, so you can use it for automated and repeatable performance tests wherever you develop. Here’s a quick walkthrough of setting up an API test:
Open JMeter.
Add a Thread Group: Right-click on the Test Plan, then navigate to Add → Threads (Users) → Thread Group.
Configure Your Requests: Add a sampler (such as HTTP Request) to the Thread Group to define your API call.
Extract Data from Responses: For example, if your API response looks like
{ "success": true, "deck_id": "3p40paa87x90", "shuffled": true, "remaining": 52 }
and you want to capture the value, you can use a Regular Expression Extractor with a pattern like .
Tweak and Debug in the GUI: Use listeners like “View Results Tree” while building and debugging your test.
Optimize for Load Testing: Before running high load scenarios, disable or remove resource-intensive listeners (like View Results Tree) to maximize performance.
With these basics, you can start crafting robust API load tests, extracting dynamic data, and simulating real-world scenarios, all without leaving your Java comfort zone.
A JMeter load test typically includes the following:

K6

K6 is an open-source tool tailored for API performance testing. Its JavaScript-based scripting makes it easy to create scalable test scenarios.
Qodex

Qodex leverages AI-driven automation to streamline testing and reduce maintenance. For example, Stripe improved test coverage and cut maintenance costs by 70%. Similarly, ZeoAuto reduced their test upkeep to just four hours a week, speeding up development by 40% [5].
Key features include:
No-code test creation
Automated test maintenance
Detailed API documentation
Qodex also delivers results at scale. For instance, Workday runs around 1,200 API tests per deployment in their CI/CD pipeline, catching edge cases that manual testing might miss.
Taurus
Taurus is an open-source framework designed to automate and simplify API performance testing by acting as a wrapper for popular tools like JMeter, Gatling, Locust, and Selenium. Unlike JMeter, which offers a graphical interface for building test plans, Taurus skips the GUI in favor of human-readable YAML configuration files.
A few advantages of using Taurus include:
Code-Friendly Configuration: Define test cases in human-readable files for easy version control.
Flexible Integrations: Run tests using underlying engines like JMeter or Gatling, but with a simplified setup.
Rapid Feedback: Get quick, consolidated results, great for agile teams seeking fast iterations.
Automation-Ready: Easily fits into automated deployment workflows.
Easy Scripting: Test scenarios are defined in YAML, making scripts both straightforward to write and easy to read, even for those newer to performance testing.
Version Control Friendly: Since configuration files are plain text, they integrate smoothly with version control systems like GitHub.
Continuous Integration Ready: Taurus scripts work well within automated pipelines, whether you’re using Jenkins or another CI/CD tool.
Real-Time Metrics with Taurus
When you run a performance test with Taurus, you’re treated to a detailed, live dashboard that brings your metrics front and center. As your test unfolds, you’ll see real-time stats such as:
Response times (min, max, average, and percentiles)
Current throughput (requests per second)
Error rates and types
Number of active users (virtual users)
Success/failure ratios
This live feedback helps you monitor how your API handles increasing load. If, for example, you notice a spike in error rates or a sudden drop in throughput as virtual users ramp up, you can spot bottlenecks immediately, long before the test completes. These metrics empower you to fine-tune your API and infrastructure on the spot, catching critical issues as they happen rather than discovering them after-the-fact in static reports.
While JMeter shines for detailed test creation using its graphical interface, Taurus excels in automation, lightweight setup, and scalable execution across different environments. Many teams use both tools together: JMeter for building granular scenarios and Taurus for orchestrating and scaling those tests in modern DevOps pipelines.
Running a Taurus Test Script from the Command Line
To kick off your Taurus test, open your command line interface and navigate to the directory containing your .yml script file. Once you’re there, simply run:
Replace your-script.yml with the actual filename of your Taurus configuration. This command starts your performance test according to the scenarios and settings defined in your YAML script. Make sure you have Taurus installed and available in your terminal path before running the command.
Extracting Response Data for Chained Requests in Taurus
Chaining requests together is a common scenario in API testing, especially when you need to capture a value from one response and use it in a subsequent call. Taurus makes this process straightforward by allowing you to extract response data using regular expressions.
Suppose you’re working with an API that shuffles a deck of cards and then draws a card from that deck. To link these requests, you’ll need to grab the deck_id from the shuffle response and pass it along to the draw call.
Here’s how you do it in Taurus:
Define your extraction logic: In your request configuration, include an
extract-regexpblock. This tells Taurus to look for a pattern in the response body (or headers, status code, etc.) and pull out the value you need.Set extraction parameters:
regexp: The regular expression pattern to find your value (e.g., for"deck_id":"abc123", use a pattern that captures the ID).default: The fallback value if the pattern isn’t found.match-no: Which matched value to use (if there's more than one).template: Which capture group from your regex.subject: Where Taurus should search (body, headers, etc.).scope: Determines if extraction scans main and sub-samples, or just the main.
Once extracted, Taurus automatically stores these variables, making them available for subsequent requests by referencing with ${variable_name}.
This approach is useful for testing workflows that depend on dynamic data, such as session tokens, unique IDs, or any values generated at runtime during the test.
Adding Transactions, Requests, and Assertions in Taurus
To structure a Taurus API performance test with transactions, requests, and assertions, you'll work within the YAML configuration to define test scenarios that reflect real user actions.
1. Define Your Scenario
Begin by naming the scenario under a scenarios: section. This name will be referenced in the execution section, connecting your scenario to test execution parameters (like concurrency and duration).
2. Add Transactions and Requests
Each transaction outlines a distinct step in your test, similar to Transaction Controllers in JMeter. Inside a transaction, specify one or more API requests to simulate behaviors such as shuffling a deck or drawing a card.
3. Use Assertions for Response Validation
Within each request, assertions verify that your API response meets expectations. For example, you might check if the response contains a specific field like deck_id:
4. Extract Data Between Requests
To tie transactions together, like shuffling a deck, then drawing cards from it, you can extract data from one response and use it in a subsequent request. Utilize regular expressions or JSONPath to capture the desired value (e.g., deck_id) from the body of the first response.
5. Chain Requests Using Extracted Data
Reference the extracted value in subsequent requests. This enables dynamic test flows that mimic real-world API usage:
Summary
These steps allow you to create rich, repeatable API test scenarios with Taurus, capturing the full journey from initial request through chained actions and validations, essential for robust API performance testing.
API Testing Methods
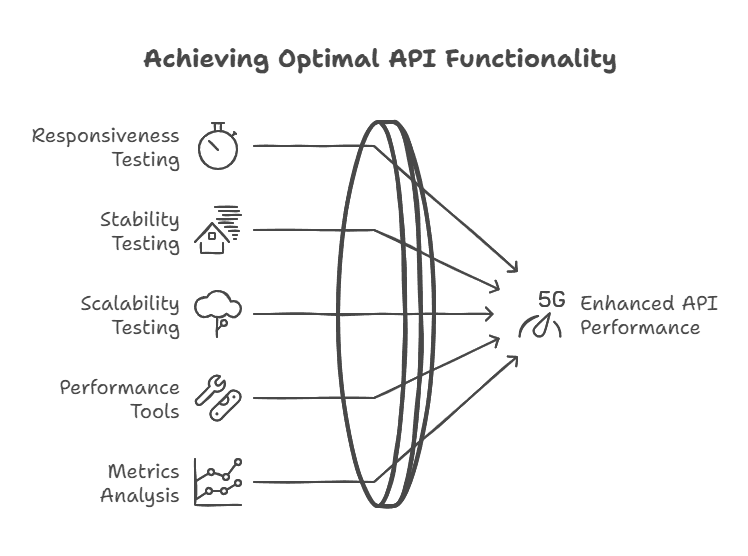
Testing an API's performance requires a structured approach to evaluate its functionality and pinpoint any bottlenecks. Here's how you can ensure your API performs well under different conditions.
Load Testing Steps
Define a controlled environment: Establish clear performance benchmarks.
Increase virtual users gradually: Monitor response times, error rates, and throughput as you scale.
Simulate peak traffic: Test how the API handles heavy usage over time.
Check recovery: Ensure the system can return to normal performance after high traffic.
Once you've set up your load tests, keep an eye on performance metrics to maintain stability over time.
Performance Tracking
After running load tests, monitor key metrics in real time. Focus on response times, error rates, and throughput to quickly identify and address any performance issues. This helps keep your API responsive and reliable.
Tool Selection Guide
Choosing the right tool is crucial for effective API testing. Consider these factors when making your selection:

Ease of use: The tool should offer an intuitive interface, allowing your team to quickly get started without a steep learning curve.
Capabilities: Assess whether the tool supports all the types of tests you need, functional, performance, security, and integration.
Integration: Make sure the tool works seamlessly with your existing workflow and other tools, especially your CI/CD pipeline.
Cost: Balance features against your budget. Many tools offer both free and paid versions, so consider what level of investment makes sense for your team's needs.
Pick a tool that not only matches your testing needs but also integrates well with your workflow. For better results, integrate the tool into your CI/CD pipeline to enable continuous testing. Later, use real traffic patterns in staging environments to uncover hidden bottlenecks.
Related Topics & Common Challenges in API and Cross-Platform Testing
When working with API and cross-platform testing, several topics and hurdles come up regularly:
Getting Started with Mock APIs: Learning how to use mock APIs helps speed up initial development and testing, especially before real endpoints are ready.
Understanding GraphQL Testing: GraphQL APIs introduce new testing requirements, such as query validation and response structure verification.
Automating vs. Manual Testing: Deciding when to automate tests and when to rely on manual testing can impact coverage and speed. Each approach has unique trade-offs.
Handling Cross-Platform Pitfalls: Consistent functionality across diverse platforms, think mobile vs. Desktop, or different operating systems, often presents headaches like environment-specific bugs and data inconsistencies.
Improving Test Reliability: Flaky tests and environment variations can erode confidence in automated testing, requiring strategies for stable, repeatable results.
Scaling Test Automation: As projects grow, ensuring test suites remain maintainable and efficient becomes increasingly important.
Exploring these areas further can help broaden your understanding and optimize your API testing process.
Conclusion
Main Points
API performance testing plays a key role in ensuring systems are reliable, fast, and capable of handling growth. Tools like Postman, JMeter, and K6 offer unique advantages: intuitive interfaces, effective load simulations, and integration with CI/CD workflows, respectively [8]. Monitoring metrics like response time, throughput, and error rates helps set benchmarks and quickly address issues.
Next Steps
Use the following phases to refine your API testing approach:

"Performance testing is essential for ensuring your APIs are reliable, fast, and can scale as needed. By understanding the different types of tests and following best practices, you can significantly improve the performance and reliability of your APIs" [1].
For future improvements, consider AI-driven tools like Qodex. These can automate testing for functionality, security, and load, cutting down on time while ensuring thorough coverage.