Top 10 Performance Testing Tools for 2026
Introduction
Ever wondered why some apps run like a dream while others feel like they're stuck in digital quicksand? The secret sauce is performance testing! It's like giving your software a fitness test before it hits the big leagues.
Imagine you're throwing a party (your app launch), and you want to make sure your house (your server) can handle all the guests (users) without the snack table collapsing or the music cutting out. That's exactly what performance testing does for your software!
In the fast-paced world of 2025, where users expect lightning-fast responses and smooth experiences, performance testing isn't just nice to have – it's a must-have. It's the behind-the-scenes hero that ensures your app can handle the spotlight when it's showtime.
So, buckle up as we dive into the world of performance testing tools that'll help your software flex its muscles and show off its speed. Whether you're a seasoned developer or just dipping your toes into the tech pool, we've got the scoop on the top tools that'll make your software sing. Let's get this digital party started!
What Is a Performance Testing Tool?
Now, before we tee up our top picks, let's clear up exactly what a performance testing tool brings to the table.
Think of it as your software’s personal trainer, pushing your app to its limits, recording its stats, and ensuring it's ready to dazzle an audience (or a horde of users). Instead of just assuming your app will run smoothly under pressure, these tools let you simulate a mad rush of users, unexpected surges, or far-flung guests crashing the party from every corner of the globe.
Here’s what you get with a solid performance testing tool:
User Simulation: Mimics real-world visitors doing all sorts of things, logging in, searching, shopping, or just lurking, so you can see how your app handles actual behavior.
Stress Level Control: Scale your test crowd from a handful of users to thousands, playing with traffic just like you’d crank up (or down) the music at your bash.
Instant Feedback: Keep an eye on how your app’s performing, in real time, so you can spot slowdowns or bumps before they snowball.
Deep Insights: Gather vital stats like response speed, error rates, resource use, and find out if your app’s breaking a sweat, or about to collapse from the pressure.
Easy Integration: Most of these tools play nicely with your development toolkit, fitting into your CI/CD pipeline so performance tests become part of your regular routine.
Protocol Variety: Whether your app's chatting over HTTP, WebSockets, or something funky like FTP, these tools can keep up with the conversation.
World-Wide Load: Test how your app holds up with users logging in from different time zones and continents, no passport required.
Reusable Scenarios: Once you have a test setup you love, just save it and use it again, no need to start from scratch every time.
Bottom line: performance testing tools help you uncover hidden bottlenecks, dodge show-stopping slowdowns, and make sure your software is ready for prime time, no matter how wild the party gets.
More Than Just One Trick Pony: Types of Performance Testing Tools
Now, before we roll out the tool red carpet, let’s talk about the many flavors of performance testing tools out there, because when it comes to keeping your app in tip-top shape, one size definitely does not fit all.
Picture performance testing like a gym routine for your app, there’s cardio, strength training, endurance, and sometimes throwing in a surprise HIIT session just to see if your app can take the heat. Here’s a quick lowdown on the main types:
Load Testing Tools: Think of these as the treadmill stress-testers. They simulate regular user traffic to see how your app behaves when the gym is just moderately busy.
Stress Testing Tools: These crank up the heat, slamming your app with way more users than usual to see where the weak spots are. Will it keep running, or will it sweat buckets?
Endurance Testing Tools: Here, it’s all about the long haul. These tools ensure your app isn’t just a sprinter, but a marathon runner, tracking performance over hours and hours of non-stop use.
Spike Testing Tools: Imagine a sudden crowd storming into your house, can your app handle an unexpected rush or does it buckle under pressure? Spike testers mimic those surprise surges.
Volume Testing Tools: These push your app’s storage muscles, checking if it can manage massive amounts of data without tripping over itself.
Scalability Testing Tools: The crowd’s growing, the stakes are higher, these tools make sure your app can gracefully scale up or down as user demand changes.
Isolation Testing Tools: Here, specific muscles (or app parts) are singled out. Isolation tools check individual components to spot bottlenecks and fine-tune performance.
Each tool comes with its own set of gym gear, some are pros at simulating thousands of users, others are wizards with massive data piles. The trick is picking the right set for your app’s unique fitness goals.
Ready to meet the star players? Let’s check out the top contenders in the performance testing world!
What Are the Main Performance Issues You Can Catch?
Now, you might be thinking: “What exactly does performance testing look for? And how do these glitches impact my user's experience?” Well, let’s break down some of the biggest offenders that these tools have their eagle eyes on:
Sparse Content on Screen: If your app leaves users staring at a mostly empty page for too long, it’s like inviting folks in and then asking them to wait in an empty room. Not a great start!
Screen Freezes: Ever had your app lock up, leaving everything stuck mid-motion? These annoying hiccups can make users feel like their device suddenly hit pause, and test every ounce of their patience.
Muffled or Blasting Audio: Too-soft audio can leave users straining to hear, while audio that's in the “wake-the-neighbors” range isn’t winning any fans either. Both can break immersion and frustrate your audience.
Slow Loading Times: If your web page takes longer than a coffee break to appear, chances are users will bounce before you can impress them. People expect speed, and anything over a few seconds can mean lost opportunities.
Network Inefficiencies: Some apps keep making new internet connections instead of reusing old ones, imagine having to knock on someone’s door every time you say hello! This drains battery, clogs up the network, and slows everything down.
DNS Failures: When your app can’t look up the addresses it needs, users end up hitting dead ends. Think of this as giving directions to a party but forgetting the street name entirely.
By spotting and tackling these issues, you're not just putting a band-aid on symptoms, you’re ensuring your digital party goes off without a hitch, leaving users wowed instead of worn out.
Top 10 Performance Testing Tools
Introduction
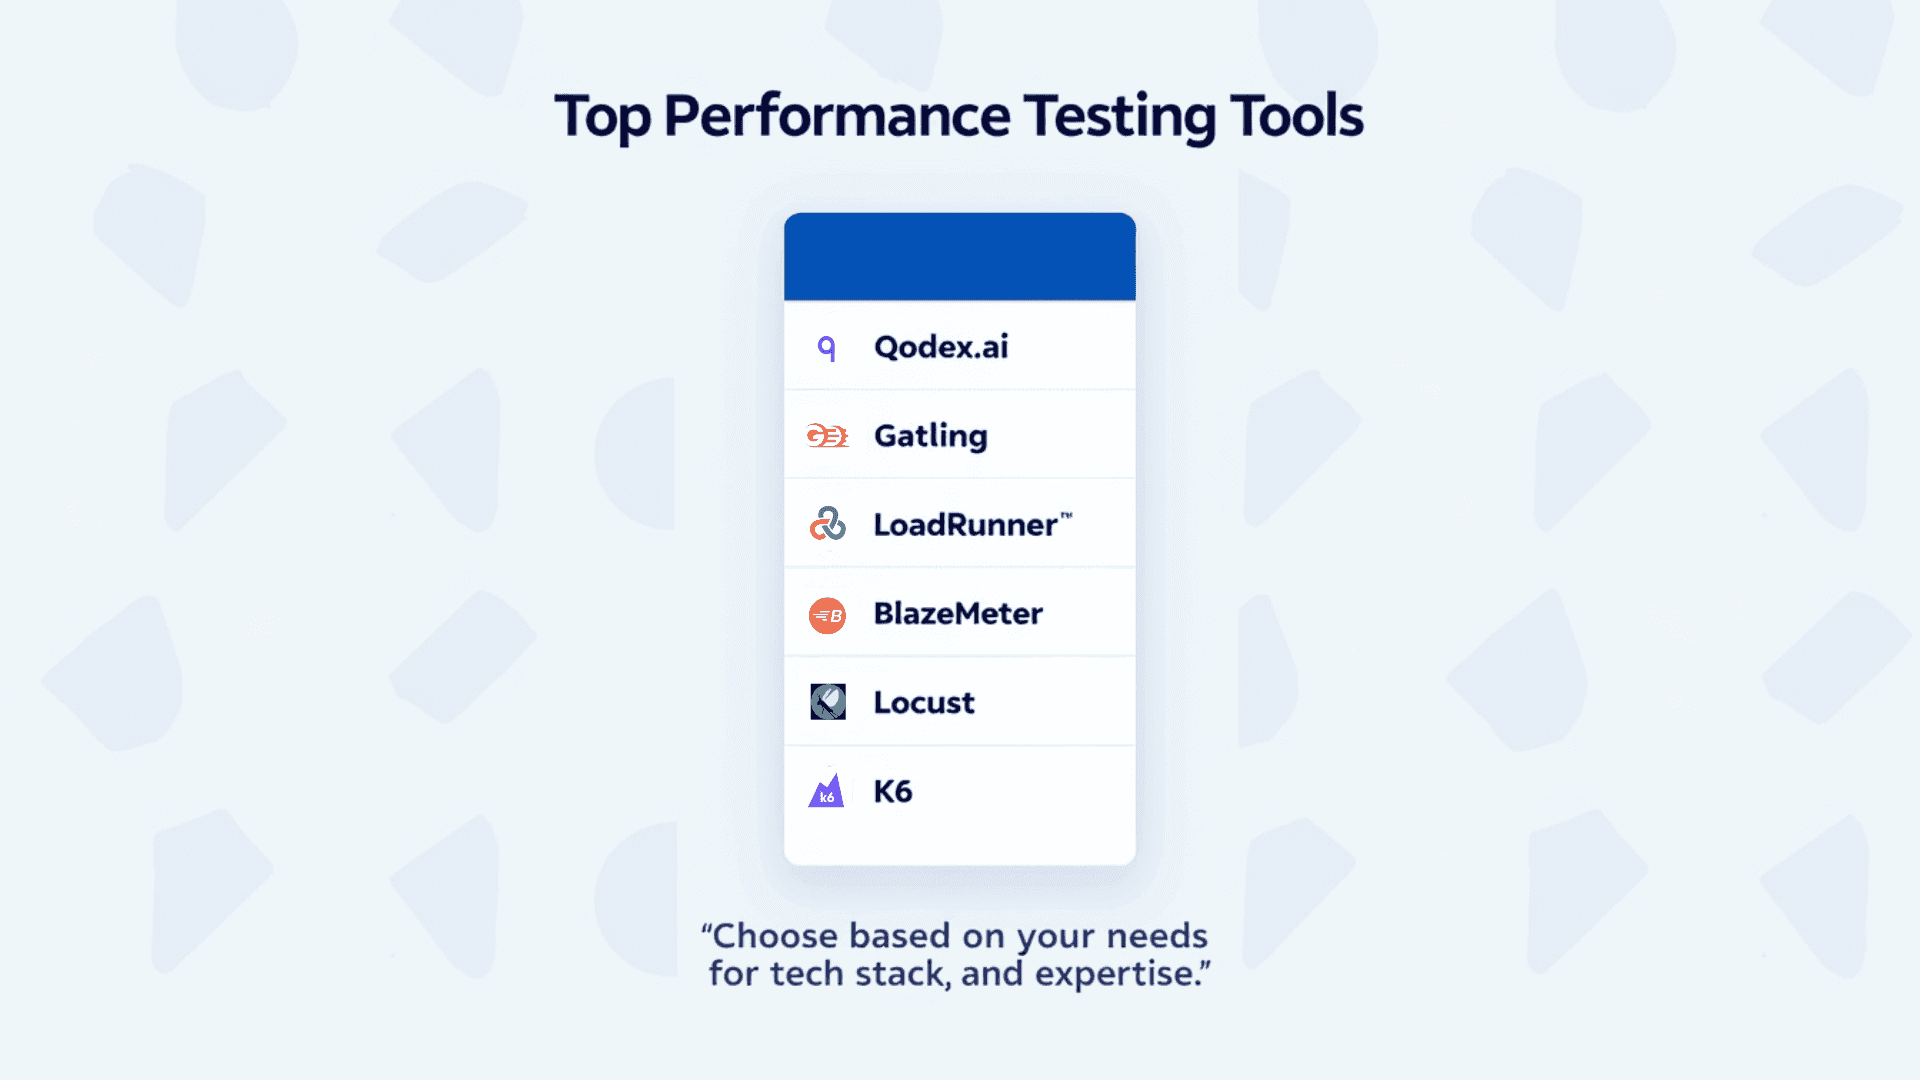
"Alright, let's dive into these awesome performance testing tools and see what makes them tick! Whether you’re building APIs, web apps, or enterprise-scale systems, performance testing ensures your product can handle real-world traffic without breaking a sweat. Here are 10 of the most powerful tools in the space, ranging from open-source to enterprise-grade solutions."
1. Qodex.ai
Description:
Qodex.ai is a modern, AI-powered performance and API testing tool built for speed, accuracy, and ease of use. Unlike traditional tools that rely heavily on manual script writing, Qodex automatically generates test scripts using AI. It provides real-time performance insights, helps identify bottlenecks, and integrates seamlessly with CI/CD pipelines for continuous testing. Its cloud-native design makes it easy to scale tests without worrying about infrastructure.
Key Features:
AI-powered test script generation
Real-time analytics and insights
Supports multiple protocols (REST, GraphQL, gRPC, WebSockets)
Cloud-based scalability with distributed load generation
Predictive analytics and anomaly detection using advanced machine learning
Holistic, end-to-end view of network behavior, including real-time capture and analysis of every network request and response
Automated detection of latency issues, failed requests, and suboptimal network performance that could impact user experience
Pros:
Reduces script creation time significantly
Intelligent scenario recommendations based on app behavior
Beginner-friendly, no coding needed
Smooth CI/CD integration for DevOps teams
Cons:
Still new compared to legacy tools (smaller community)
May require fine-tuning for complex enterprise apps
2. Gatling
Description:
Gatling is a Scala-based load testing tool that’s a favorite among developers building APIs and microservices. Known for its speed and efficiency, Gatling uses an asynchronous, event-driven architecture that can handle thousands of concurrent users with minimal resources. It’s ideal for performance-heavy scenarios where you need real-time metrics and detailed HTML reports.
Key Features:
Scala-based DSL for test scripting
High performance with minimal resource usage
Real-time reporting and metrics
Asynchronous, non-blocking architecture for simulating thousands of users on a single machine
Detailed and customizable reports with comprehensive metrics and charts
Scalable design, able to run tests across multiple nodes for large user loads
Modular and extensible, developers can plug in custom behaviors or protocols
Integrates easily with CI/CD pipelines for real-time performance feedback
Supports cloud-based performance testing for scalable load generation
Pros:
Excellent for handling high loads
Open-source with active community support
Great for API and microservices testing
Detailed and customizable reports
Cons:
Requires Scala knowledge for advanced use
Smaller protocol support compared to JMeter
3. BrowserStack App Performance
Description:
BrowserStack’s performance testing solution focuses on mobile app performance. Instead of relying on emulators, it runs tests on real devices across networks, giving authentic performance insights. Teams can simulate network conditions (2G, 3G, 4G, throttling) and analyze performance metrics like response times, CPU usage, memory consumption, and user flows.
Key Features:
Real device testing (Android & iOS)
Network condition simulation
Detailed app performance and flow analysis
Integrates with other BrowserStack testing tools
Detailed performance metrics and user flow analysis
Access to thousands of real devices in 50+ locations worldwide for remote app testing, enabling testers to replicate real-world scenarios and measure actual user conditions more accurately than with simulators
Pros:
Real-world results from physical devices
Fast setup with cloud-based access
Comprehensive mobile performance insights
Great for QA and product teams testing apps globally
Cons:
Limited to mobile apps (not for APIs/web apps)
Paid plans required for large device coverage
4. LoadRunner (by Micro Focus)
Description:
LoadRunner is one of the oldest and most reliable enterprise-grade performance testing tools. It supports a wide variety of protocols (web, mobile, ERP, Citrix, etc.), making it popular among large organizations. It’s known for advanced correlation, parameterization, and scalability, making it suitable for complex test environments.
Key Features:
Supports a wide range of technologies and protocols
Advanced correlation and parameterization
Comprehensive analysis and reporting
Simulates high volumes of user traffic to test scalability and performance
Offers in-depth analytics and detailed reporting for performance analysis
Enables cloud-based load testing to scale without extra hardware
Pros:
Robust and reliable for enterprise-level testing
Handles complex scenarios with ease
Extensive protocol support
Strong integration capabilities with other HP tools
Cons:
Expensive for small teams/startups
Steeper learning curve compared to modern tools
5. BlazeMeter
Description:
BlazeMeter is a cloud-based performance testing platform fully compatible with JMeter, Gatling, and Selenium. It extends open-source tools with massive scalability, advanced analytics, and team collaboration features. Perfect for organizations looking to combine JMeter familiarity with cloud-based flexibility.
Key Features:
Cloud-based testing with massive scalability
Supports open-source tools like JMeter
Real-time analytics and reporting
Distributed testing across geographies for thousands of virtual users
Scriptless test creation for quick setup, no deep scripting required
Continuous integration (CI) ready, built for CI/CD pipelines
Supports a broad range of protocols: HTTP/HTTPS, WebSockets, AMF, and more
Offers functional, API, and end-to-end performance testing
Pros:
Easy to use with a gentle learning curve
Excellent for large-scale tests
Integrates well with CI/CD tools
Collaborative features for team testing
Cons:
Paid pricing can be high at scale
Complex features may overwhelm beginners
6. Locust
Description:
Locust is an open-source Python-based load testing tool with a simple yet powerful architecture. It allows teams to define user behavior in Python code, making tests both flexible and developer-friendly. Locust supports distributed testing across multiple machines and provides a real-time web UI for monitoring tests.
Key Features:
Python-based scripting
Distributed and scalable architecture
Real-time web interface for test monitoring
Data-driven testing, dynamically generate or use existing datasets
Cloud execution for simulating various load levels
Scenario reusability and visual modeling for efficient test setup
Pros:
Highly customizable and flexible
Great for developers familiar with Python
Open-source and free to use
Lightweight and easy to set up
Cons:
Requires Python knowledge
Less intuitive for non-technical testers
7. K6 (by Grafana Labs)
Description:
K6 is a modern performance testing tool designed with developers in mind. It uses JavaScript for scripting and is optimized for CI/CD workflows. With both open-source and cloud options, it’s one of the fastest-growing tools in performance testing.
Key Features:
JavaScript-based scripting
Built-in HAR support
Cloud and on-premise execution options
Scriptable tests for complex user scenarios
Supports APIs, microservices, and websites
Integrates with Grafana for advanced data visualization
Built-in thresholds for pass/fail criteria in automated pipelines
Extensible and modular: Easily plug in custom behavior, protocol support, or extend capabilities with your own modules.
Pros:
Developer-friendly with JS scripting
Integrates easily with existing workflows
Good balance of simplicity and power
Extensible through custom metrics and outputs
Cons:
Smaller protocol coverage compared to LoadRunner
No built-in GUI (CLI-focused)
8. NeoLoad (by Tricentis)
Description:
NeoLoad is a performance and load testing tool designed for enterprises that need codeless test creation alongside support for advanced technologies like SAP, Citrix, Oracle, and Salesforce. It’s highly scalable and integrates with DevOps pipelines for continuous performance testing.
Key Features:
Codeless script creation
Supports modern technologies like SAP and Citrix
Advanced correlation and parameterization
Intuitive design and analysis with a focus on usability
Enables creation of realistic virtual users for accurate load testing
Strong collaborative and integration features for teams
Why NeoLoad Stands Out
NeoLoad is designed with scalability and flexibility in mind, making it a solid option for enterprises that need to simulate thousands of virtual users or manage complex, distributed load tests. Its intuitive interface lets teams quickly create, execute, and analyze performance tests, no deep scripting knowledge required. NeoLoad’s real-time dashboards make it easy to pinpoint bottlenecks and performance issues as they happen.
Extensive Integrations
NeoLoad integrates seamlessly with popular CI/CD tools like Jenkins, Bamboo, and TeamCity, allowing you to embed performance testing directly into your deployment pipelines. For teams focused on observability, NeoLoad also supports connections to platforms like New Relic and Dynatrace, offering end-to-end insights throughout the testing process.
Collaboration and Efficiency
With features supporting collaborative workspaces and version control, NeoLoad helps teams manage test assets efficiently across projects. Test scenarios can be reused or adapted for different environments, streamlining ongoing performance testing and reducing redundant effort.
Flexible Testing for Modern Needs
Whether you're testing APIs, web apps, mobile platforms, or complex enterprise systems, NeoLoad’s broad protocol support and advanced analytics make it a versatile, future-proof choice for organizations aiming for both speed and depth in their performance testing.
Pros:
User-friendly interface for less technical users
Robust support for enterprise applications
Strong analytics and reporting capabilities
Good for both web and mobile testing
Cons:
Expensive for smaller teams
More suited for enterprise-scale projects
9. WebLOAD
Description:
WebLOAD is an enterprise-grade performance testing solution with strong support for JavaScript scripting and enterprise protocols. It’s flexible enough to handle simple load tests or complex business scenarios and provides integrated monitoring and root cause analysis.
Key Features:
JavaScript-based scripting
Native support for enterprise protocols
Integrated performance monitoring
Distributed testing to simulate many concurrent users from multiple locations
Detailed analytics and reporting for in-depth performance analysis
Enables automatic test design and generation, reducing manual efforts
Pros:
Very flexible for complex enterprise needs
Detailed performance insights with root cause analysis
Scales well for large enterprises
Good integrations with monitoring tools
Cons:
Paid tool, not ideal for startups
Less community adoption than JMeter/K6
10. Dynatrace
Description:
Dynatrace goes beyond traditional performance testing, it’s an AI-powered full-stack monitoring platform. It automatically discovers applications, dependencies, and bottlenecks, making it great for continuous performance monitoring alongside load testing. Perfect for companies that want observability + performance in one tool.
Key Features:
AI-powered full-stack monitoring
Automatic discovery and dependency mapping
Real user monitoring + synthetic monitoring
Deep analytics for apps, infrastructure, and UX
Pros:
Beyond testing, offers complete observability
AI-driven problem detection and root cause analysis
Great for enterprise-scale systems
Continuous performance visibility
Cons:
Expensive, enterprise-focused
Requires proper setup to unlock full potential
Proactive Issue Detection and Root Cause Analysis
Leveraging advanced machine learning and AI, Dynatrace goes beyond simple monitoring, it automatically detects and pinpoints the root causes of performance issues, whether they originate from the network, device, or deeper architectural layers of your app. By continuously analyzing real user interactions, Dynatrace helps surface user experience issues as they actually occur, highlighting key areas that may require further investigation. This proactive detection not only identifies symptoms but also delivers precise insights into what went wrong, helping teams quickly implement corrective measures and ensure a smooth, reliable experience for end users.
Integrations and Monitoring Capabilities
Dynatrace stands out for its robust integration with major CI/CD tools, such as Jenkins, Bamboo, and TeamCity, enabling seamless automation in your development pipeline. It also supports a wide array of monitoring and observability solutions, making it a versatile choice for teams looking to unify performance data across their tech stack. Dynatrace’s compatibility with popular monitoring tools like Grafana and AppDynamics ensures that you can correlate real-time performance metrics with system health, streamlining both troubleshooting and optimization. This flexibility allows teams to gain actionable insights during every phase of testing and deployment, whether running simple load tests or complex, multi-layered performance evaluations.
In addition to its core strengths, Dynatrace provides detailed, AI-driven analytics that help identify bottlenecks, user experience issues, and infrastructure problems before they escalate. The platform’s ability to automatically discover application dependencies and generate topology maps further simplifies root cause analysis and accelerates mean time to resolution.
By integrating Dynatrace into your workflow, you not only enhance your ability to monitor and analyze application performance but also empower your team to deliver more resilient, high-performing software with confidence.
Other Tools
11. Apache JMeter
Key Features:
Cross-platform compatibility, thanks to its Java foundation
Supports a wide range of protocols including HTTP, HTTPS, FTP, SOAP, JDBC, LDAP, and more
Intuitive graphical interface for building complex test plans with ease
Can simulate heavy loads by managing multiple threads and users
Easily extendable with a massive ecosystem of plugins and the option to develop custom components
Offers detailed, real-time results through interactive charts and reports
Pros:
Versatile and adaptable to nearly any type of application or server
Accessible to both newbies and performance testing pros
Open-source with a thriving user community
Supports distributed testing for large-scale scenarios
Integrations:
JMeter plays nicely with popular CI/CD tools such as Jenkins for seamless automation in your pipelines. Looking to take things to the cloud? Hook it up with BlazeMeter to run tests at scale, no extra hardware required. Plus, with its treasure trove of plugins, you can connect JMeter to a host of other platforms and tools to supercharge your performance testing workflow.
LoadNinja
Key Features:
Create load tests quickly without writing scripts, thanks to an intuitive recorder that captures user actions for instant playback.
Run large-scale tests in real browsers across different global locations to truly mimic real-world user traffic.
Dive deep into your results with advanced, real-time analytics, pinpoint exactly where slowdowns and bottlenecks are hiding.
Get hands-on and interactive: debug your virtual users live right from the browser, ensuring every test configuration is accurate.
Inspect every move your virtual users make, track network requests, responses, and individual actions for powerful troubleshooting.
Integration Capabilities:
LoadNinja plays nicely with major CI/CD platforms like Jenkins. This means you can weave fast, reliable performance testing straight into your development pipeline, keeping your app’s speed and reliability top-notch at every stage.
13. Loader.io
Key Features:
Simple, no-fuss load testing for web apps and APIs
Straightforward setup, no heavy scripting required
Real-time dashboards to visualize test results as they happen
Capable of simulating thousands of users hitting your endpoints
Pros:
Designed for rapid testing, great for quick performance checks or smoke tests
Especially friendly for developers who want something up and running fast
Integrates easily with CI/CD workflows (like GitHub Actions)
Plays nicely with popular monitoring solutions such as New Relic, so you can dig deeper into bottlenecks
If you need a lightweight, cloud-based testing tool that's perfect for smaller teams or fast-moving projects, Loader.io delivers the goods, without weighing you down with setup overhead.
14. Uptrends
Key Features:
Global monitoring for web applications, allowing you to track site performance from multiple locations around the world
Detailed waterfall charts to visualize and troubleshoot load times for every website element
Synthetic user testing, simulating real-user interactions for a realistic performance snapshot
Monitoring tailored for both websites and mobile applications
Pros:
Comprehensive and visually rich analytics for both web and mobile performance
Powerful for pinpointing slow resources or bottlenecks
Automated testing that integrates smoothly with Slack, Microsoft Teams, and popular CI/CD workflows
Performance alerts and reporting made easy for teams
With Uptrends, you get a sophisticated toolkit for keeping tabs on your site’s speed and reliability, wherever your users may be logging in from.
15. RedLine13
Key Features:
Cloud-powered load generation for truly massive tests
Supports popular testing frameworks like JMeter and Gatling
Real-time analytics to watch your test unfold live
No artificial limits, run as many users and tests as your heart (and app) desires
Pros:
Super cost-effective, especially for large-scale testing (your CFO will thank you)
Integrates seamlessly with AWS and other major cloud providers
Plays nice with Jenkins for automated test execution
Compatible with a variety of monitoring tools for deeper insights
RedLine13 is ideal for anyone needing to simulate huge spikes in user traffic without breaking the bank. If you’re ready to push your app to the limit, RedLine13 brings the heavy artillery, without the heavy setup.
How Performance Testing Tools Work
So, how do these digital fitness trainers actually whip your apps into shape? Picture a performance testing tool as your secret squad of virtual party crashers. Instead of waiting for real users to show up and (potentially) break your software, these tools create simulated visitors, think of them as eager guests ready to test every door, window, and snack table in your house.
Here’s the magic in a nutshell:
Simulated Traffic: Performance testing tools unleash waves of artificial users on your app or website, sending requests and interactions much like real users would, sometimes dozens, sometimes thousands at once.
Stress Under Pressure: By ramping up the number of users, these tools check how your system holds up when the crowd grows. Will it keep serving up appetizers (responses) without a hitch? Or will it start dropping plates (lagging or crashing)?
Pinpointing Weak Spots: As the activity heats up, the tool keeps an eye out for slowdowns, crashes, and resource hogs, those hidden issues that only show themselves under pressure.
Room to Grow: The best tools don't just reveal problems; they help you track down exactly where and why your software struggled, giving you everything you need to bulk up your infrastructure or tune your code.
All in all, performance testing tools are the ultimate rehearsal dinner for your app’s big event, making sure your software is ready to greet every guest with a high-five, no sweat, and definitely no digital quicksand.
How AI and Machine Learning Are Supercharging Performance Testing
Now, let’s talk about the new kids on the block: artificial intelligence and machine learning. You might be picturing robots running your tests, but it’s even cooler than that! These smarty-pants algorithms are turning up the volume on performance testing, making it smarter, faster, and more reliable than ever.
Here's how they're rocking the performance testing party:
Smarter Test Creation: Instead of spending hours writing and maintaining test scripts, AI-powered tools like StormForge and Tricentis NeoLoad can automatically generate and update them for you. It's like having a super-productive assistant who never gets tired!
Finding Bottlenecks, Fast: Machine learning doesn’t just follow a playbook; it learns your app’s quirks and predicts where trouble might brew. If your server stumbles under pressure, these tools quickly spot performance hiccups before users ever notice.
Resource Optimization: Say goodbye to over-provisioned servers. AI analyzes test results and suggests the perfect balance between performance and resource use, stretching your cloud budget without breaking a sweat.
Continuous Improvement: Integrating with your CI/CD pipeline, AI-based tools run tests with every code change, meaning your app stays in tip-top shape, even as it evolves.
Seamless Integrations: Many of these tools play well with monitoring favorites like Prometheus and Grafana, so you get a crystal-clear view of your app’s health in real time.
In short, AI and machine learning aren’t just buzzwords in performance testing, they’re your behind-the-scenes coaches, making sure your app is always ready for the main event.
Load Testing, Stress Testing, and Scalability Testing: What’s the Difference?
Now, let’s clear up some of the confusion around three performance testing heavyweights: load testing, stress testing, and scalability testing. Think of them as the personal trainers in your software’s gym, each with their own specialty!
Load Testing: Picture your app during peak party hours, the pizza’s hot, everyone’s dancing, and you want to see if your place can handle the usual crowd. Load testing does just that: it checks how your software performs under typical, expected user traffic. It’s all about making sure things don’t go haywire when your app gets busy during a big launch or on a Monday morning.
Stress Testing: This one’s more like inviting the whole neighborhood (and their cousins) to your party to see just how much your house can really take, right up until the floorboards creak. Stress testing pushes your app beyond its comfort zone, seeing what happens when things get wild. It’s about finding the breaking point so you know how (and where) your app fails, and where to reinforce before disaster strikes.
Scalability Testing: Finally, scalability testing asks the question, “If my guest list keeps growing, can the house keep up?” Here, you gradually ramp up the number of users or the workload to see how well your software grows with demand. It’s about future-proofing your app, making sure it can gracefully expand to handle more users without crashing the party.
So whether you’re planning a quiet evening or an all-out bash, these testing types make sure your software is ready for whatever comes its way.
Customizable Dashboards: The Secret Sauce for High-Impact Testing
Why settle for generic metrics when you can fine-tune your view and see just what matters? Customizable dashboards put performance testing teams in the driver's seat, letting them spotlight the KPIs and metrics that actually move the needle for their projects.
Here’s why these dashboards are a game-changer:
Tailored Insights: Focus on what’s critical, be it load times, error rates, or resource utilization, so you’re not drowning in irrelevant data.
Efficient Analysis: Team members can prioritize the metrics that align with their specific goals, cutting through the noise and zeroing in on bottlenecks faster.
Seamless Integration: Popular tools like Grafana or DataDog let you build dashboards that connect with multiple data sources, giving a unified view across all your environments.
Collaboration Made Easy: A well-crafted dashboard helps teams speak the same language, making it easier to share findings and rally around priorities.
In short, customizable dashboards transform performance data from an overwhelming flood into an actionable control panel, perfect for teams aiming to detect, diagnose, and defeat slowdowns before users ever notice.
Integrations That Power DevOps Workflows
When it comes to making performance testing an effortless piece of your DevOps puzzle, modern tools have really stepped up their game. Today’s performance testers don’t just stand alone, they’re team players, slotting right into your favorite build-and-deploy pipelines faster than you can say “continuous integration.”
Here’s how most performance testing solutions lend a hand to your DevOps process:
Seamless CI/CD Integration: Tools often offer plug-and-play compatibility with CI/CD giants like Jenkins, Bamboo, GitHub Actions, and TeamCity. This lets you trigger performance tests automatically with every code push, merge, or deployment, no extra clicks required.
Cloud Support for Scalability: Many platforms natively support cloud infrastructure, making it easy to scale your testing up or down as your project demands, without wrestling with server closets or local hardware.
Real-Time Monitoring and Reporting: Integrations with leading observability and monitoring platforms, think Grafana, Prometheus, New Relic, and Dynatrace, mean you’re not just seeing pass/fail. Instead, you get rich, actionable metrics in real-time, so bottlenecks are spotted before users ever notice.
DevOps Ecosystem Compatibility: Whether your team lives in Azure DevOps, GitLab, or another development suite, performance testing tools are designed to play nice, keeping all your testing, deployment, and analytics data flowing in one harmonious automation symphony.
Support for Automated Workflows: By automating performance testing as part of your build pipeline, you eliminate manual steps, speed up feedback, and unleash more robust, bug-free releases.
In short, performance testing tools today make DevOps integration feel less like a chore and more like having a helpful robot sidekick. Now you can focus on building, testing, and shipping code, while your tools handle the heavy lifting behind the scenes.
Top 10 Performance Testing Tools
Alright, let's dive into these awesome performance testing tools and see what makes them tick!
1. Qodex.ai

Key Features:
AI-powered test script generation
Real-time analytics and insights
Supports multiple protocols and technologies
Cloud-based scalability
Pros:
Reduces script creation time significantly
Intelligent test scenario recommendations
Easy to use, even for non-technical team members
Seamless integration with CI/CD pipelines
2. Gatling

Key Features:
Scala-based DSL for test scripting
High performance with minimal resource usage
Real-time reporting and metrics
Pros:
Excellent for handling high loads
Open-source with active community support
Great for API and microservices testing
Detailed and customizable reports
3. BrowserStack App Performance

Key Features:
Real device testing for mobile apps
Network condition simulation
Detailed performance metrics and user flow analysis
Pros:
Tests on actual devices, not emulators
Comprehensive insights into mobile app performance
Easy to set up and use
Integrates well with other BrowserStack products
4. LoadRunner

Key Features:
Supports a wide range of technologies and protocols
Advanced correlation and parameterization
Comprehensive analysis and reporting
Pros:
Robust and reliable for enterprise-level testing
Handles complex scenarios with ease
Extensive protocol support
Strong integration capabilities with other HP tools
5. BlazeMeter

Key Features:
Cloud-based testing with massive scalability
Supports open-source tools like JMeter
Real-time analytics and reporting
Pros:
Easy to use with a gentle learning curve
Excellent for large-scale tests
Integrates well with CI/CD tools
Collaborative features for team testing
6. Locust

Key Features:
Python-based scripting
Distributed and scalable architecture
Real-time web interface for test monitoring
Pros:
Highly customizable and flexible
Great for developers familiar with Python
Open-source and free to use
Lightweight and easy to set up
7. K6

Key Features:
JavaScript-based scripting
Built-in HAR support
Cloud and on-premise execution options
Pros:
Developer-friendly with JS scripting
Integrates easily with existing workflows
Good balance of simplicity and power
Extensible through custom metrics and outputs
8. NeoLoad

Key Features:
Codeless script creation
Supports modern technologies like SAP and Citrix
Advanced correlation and parameterization
Pros:
User-friendly interface for less technical users
Robust support for enterprise applications
Strong analytics and reporting capabilities
Good for both web and mobile testing
9. WebLOAD

Key Features:
JavaScript-based scripting
Native support for enterprise protocols
Integrated performance monitoring
Pros:
Flexible and powerful for complex scenarios
Good for testing a wide range of applications
Strong analytics and root cause analysis
Scalable for large enterprise needs
10. Dynatrace

Key Features:
AI-powered full stack monitoring
Automatic discovery and mapping
Real user monitoring
Pros:
Provides deep insights beyond just performance testing
Excellent for continuous performance monitoring
AI-driven problem detection and analysis
Comprehensive view of application, infrastructure, and user experience
How to Choose the Right Performance Testing Tool
Alright, folks! You've got this buffet of amazing tools in front of you, but how do you pick the one that'll make your software sing? Let's break it down:
Identify testing requirements
First things first – what's your testing flavor? Are you all about web apps, or is mobile your jam? Maybe you're diving into the world of microservices? Knowing what you're testing is like picking the right superhero for the job. You wouldn't send Aquaman to fight a fire, right? Be specific, think about whether you need to anticipate crashes, spot slow response times, or catch sneaky bugs before they ship. The clearer you are about your goals, the better your tool will fit.Consider compatibility
Next up, let's talk tech matchmaking. Your chosen tool needs to play nice with your existing setup. It's like making sure your new fancy coffee maker fits on your kitchen counter. Check if the tool supports your programming languages, frameworks, and protocols. No point in bringing a salsa dancer to a waltz competition! And don’t forget: some tools are tailored for web services, while others shine with mobile or enterprise-level applications.Evaluate ease of use
Now, let's talk user-friendliness. Are you a coding wizard, or do you break out in hives at the sight of a command line? Some tools are like a walk in the park, while others might feel like climbing Everest in flip-flops. Pick one that matches your team's skills and doesn't require a PhD to operate. If your team loves scripting (hello, Python or JavaScript), look for tools that let you flex those muscles. Prefer to point and click? Opt for a codeless interface.Analyze key features
Time to go feature hunting! Look for goodies like real-time monitoring, detailed reporting, script reusability, and advanced analytics. It's like choosing a Swiss Army knife – the more useful tools it has, the better equipped you'll be for any testing situation. Some tools even offer distributed architectures or AI-powered insights to help you catch issues early and get your product to market faster.Assess scalability and load generation capabilities
Last but not least, think big! Can your chosen tool handle the heat when you crank up the user load? You want a tool that can flex its muscles and simulate thousands of users without breaking a sweat. It's like making sure your boat can handle rough seas before you set sail. Look for distributed and scalable solutions that grow with your needs, whether you’re testing a simple web form or a bustling enterprise platform.
By lining up your requirements with these factors, you’ll be set to pick a performance testing tool that not only fits your project but also helps you discover issues before your users do.
But wait, before you dash off to click "download," remember that navigating the world of performance testing tools can feel like wandering through a maze of endless choices. The secret sauce? Align your tool choice with your project's specific needs, your team's expertise, and, of course, your budget. Take a moment to really assess what you need, are analytics your top priority, or is seamless integration with your CI/CD pipeline a must-have?
If you can, get your hands dirty with a trial or two. A little hands-on time can reveal whether a tool truly fits your workflow, or if it's just a shiny gadget that looks great but doesn’t deliver. The right tool is more than a fancy add-on, it's your safety net to ensure a stellar user experience and future-proof your app against those dreaded scalability hiccups. In a world where users expect instant results, having the right performance testing tool isn't just a nice-to-have, it's essential.
So, choose wisely, test thoroughly, and set yourself up for smooth sailing (or at least fewer icebergs) on your software journey!
Why Monitoring a Wide Range of KPIs Matters
So, why fuss over a laundry list of KPIs instead of just the basics? Here’s the deal: when you expand your horizons beyond the usual suspects like response times and error rates, you start catching sneaky issues before your users do. Think of standard metrics as your rearview mirror, they show you the big stuff, but zooming in on finer details is like turning on your high beams during a foggy night drive.
Digging into metrics such as latency, frame rates, battery consumption, or even video MOS (Mean Opinion Score), gives you a backstage pass to your app’s real-world performance. For instance, slow frame rates might not trigger an outright error, but they can quietly destroy your user’s experience. Poor battery usage can send mobile users running for their chargers (or worse, uninstalling your app).
By keeping tabs on a broad spectrum of performance indicators, you’re not just putting out fires, you’re sniffing out the tiniest sparks before they can grow. This makes it much easier to fine-tune your application, troubleshoot bottlenecks, and deliver that buttery-smooth experience your users expect. After all, it’s the details that separate a good app from a great one.
Understanding Performance Counters
Now, let's decode one of those techie terms you see tossed around: performance counters. What's their deal during performance testing?
Think of performance counters as your software's fitness trackers, they keep tabs on how your system's vital signs behave under pressure. During testing, they quietly record things like memory consumption, CPU load, disk read/write speeds, and even network traffic. With these numbers in hand, you can spot bottlenecks, diagnose slowdowns, and make smart decisions about tuning your system.
In short, performance counters turn guesswork into real data, helping you ensure your app doesn't collapse like a soufflé in a thunderstorm when the user load increases. Pay attention to these stats, they’re your early warning system for potential trouble ahead.
Why does "think time" matter in your performance testing scripts?
Picture this: you've unleashed a swarm of virtual users, but they're sprinting through your application like they're chasing a gold medal, no pauses, no hesitation, just non-stop clicks. In reality, humans aren't robots. We pause to read, fumble for passwords, or maybe grab a coffee mid-checkout.
That's where "think time" steps in. By adding intentional delays between actions in your scripts, you mimic how real users interact with your software. This isn't just for show, it ensures your tests reflect genuine traffic patterns. With think time, your results are more accurate, helping you spot bottlenecks and performance hiccups you’d actually encounter in the wild (not just in a lab). Plus, you'll avoid overloading your servers with unrealistically rapid-fire requests, which could skew your findings and send you chasing phantom issues.
In short: including "think time" is your ticket to reliable, real-world-ready performance test results, no superhero speed required.
Conclusion
Conclusion
As we wrap up our journey through the world of performance testing tools, remember: your software's success hinges on its ability to perform under pressure. These top 10 tools for 2025 offer a range of solutions to fit every project and skill level. From AI-powered insights to user-friendly interfaces, there's a perfect match waiting for you. Don't let performance issues derail your hard work. Dive in, explore these tools, and watch your software thrive. Your users (and your stress levels) will thank you. So go ahead, pick your tool, and let's make 2025 the year of lightning-fast, rock-solid applications!