Top 5 Metrics for API Throughput Testing
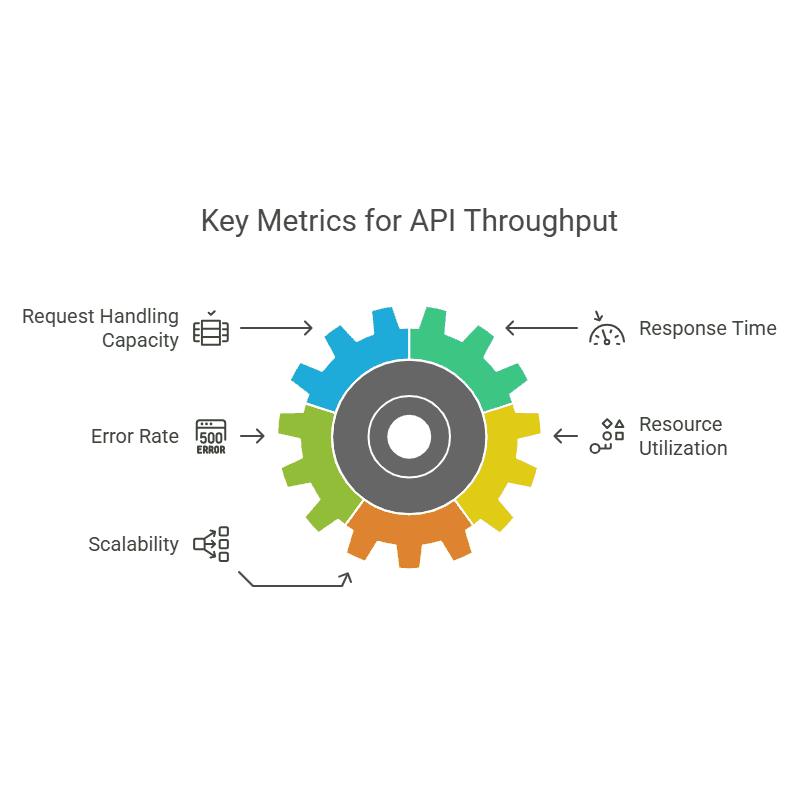
Want to ensure your API performs at its best under heavy load? Focus on these 5 key metrics:
Requests Per Second (RPS): Measures how many requests your API can handle per second.
API Response Time: Tracks how quickly your API responds to requests, aiming for under 1 second for most applications.
API Error Rates: Identifies the percentage of failed requests to detect issues early.
Active Concurrent Users: Monitors the number of users accessing your API simultaneously during peak times.
Network Data Transfer Speed: Evaluates how efficiently data moves between systems, reducing latency and bottlenecks.
Why These Metrics Matter
RPS and Response Time directly impact user experience and satisfaction.
Error Rates help maintain reliability and trust.
Concurrent Users determine scalability and system capacity.
Data Transfer Speed ensures smooth, fast communication.
By tracking these metrics, you can identify bottlenecks, improve performance, and scale your infrastructure effectively. Tools like Qodex or Apache JMeter can automate testing and provide real-time insights for better decision-making.
1. Requests Per Second (RPS)
What Is RPS and Why Does It Matter?
Requests Per Second (RPS) measures how many requests an application can handle in one second. It’s a key indicator of an API’s capacity and ability to scale under load.
The formula is simple: RPS = Total Number of Requests / Total Time (in seconds). For example, if your API processes 1,000 requests in 60 seconds, your RPS is 16.67. Understanding this metric helps evaluate how well your API performs under different conditions.
How to Measure RPS
To get accurate RPS data, monitor it over different time intervals. Tools like Apache JMeter can track elapsed time from when a request starts to when the final byte is received.
Here’s how RPS can grow over time based on different scenarios:

How RPS Affects API Performance
RPS is closely tied to system performance and user experience. For instance, in one test, 50 users generated 100 RPS with a response time of 8ms. Scaling up to 500 users resulted in 500 RPS, maintaining the same response time. But with 750 users, the system hit a limit, managing only 530 RPS while response time jumped to 30ms.
"RPS is one of the essential performance metrics. It is quite often referred to as throughput, and I like this term better, as it is self-explanatory. It simply tells us how many requests per second the system under test can handle." - Luděk Nový
RPS alone doesn’t tell the whole story. Pair it with response times to get a clearer picture. For example, 15 RPS with a 5ms response time is far better than 15 RPS with a 20ms response time. This combination helps pinpoint bottlenecks and fine-tune resource allocation.
Tools like Qodex simplify this process by automating API testing and tracking RPS alongside other metrics. This ensures your API operates efficiently while maintaining stability under varying loads.
2. API Response Time
What It Is and Why It Matters
API response time is the time it takes from when a client sends a request to when the full response is delivered. Leading APIs typically respond within 0.1 to 1 second. To put this into perspective, even small delays can have big consequences: a 100ms increase in latency can cost Amazon around 1% of its profit, while a 500ms delay might cause Google to lose 20% of its traffic.
How to Measure It
One way to evaluate response times is by analyzing percentiles. This includes the median (representing the typical user experience), the 95th percentile (close to the worst-case scenario), and the 99th percentile (the absolute worst-case scenario). You can also categorize response times to understand their impact on users:

These measurements help illustrate how response time fluctuations can influence user experience and overall throughput.
Why It Affects API Performance
For real-time apps, responses under 0.1 seconds are crucial. E-commerce platforms, on the other hand, generally aim for under 1 second. Tools like Qodex can monitor and test API performance under various loads to ensure it remains consistent. Stability is just as vital as speed - a steady API that handles increasing traffic without performance dips will outperform one with inconsistent response times.
Read More about API Performance Testing
3. API Error Rates
What Are API Error Rates and Why Do They Matter?
API error rates measure the percentage of failed requests over a specific time period. You calculate it by dividing the number of failed requests by the total requests. For instance, if an API processes 10,000 requests and 500 of them fail, the error rate is 5% . This metric becomes especially critical in high-traffic situations, where increased load can expose hidden problems.
How to Measure API Error Rates
Error rates can be categorized based on where the failure occurs in the transaction and the type of HTTP response. Here's a breakdown:

Modern tools can track these errors in real time. For example, Apigee Edge’s Error Code Analysis dashboard provides detailed insights into proxy and target errors, helping teams pinpoint issues faster. Setting real-time thresholds and alerts ensures errors are caught before they escalate.
How Error Rates Affect API Performance
High error rates can seriously impact API performance. When errors occur, they often trigger retries or stalled requests, which put additional strain on system resources.
"I can confidently say that you don't. I'll go a step further and state that throughout my career, every system I've worked on that relied on aggregate views of errors was a complete dumpster fire. In every team where we instead chose to read all the errors, reliability naturally improved over time." – Evan Boyle
For example, an API handling 1,000,000 yearly requests might need to keep its error rate below 0.3%. As traffic increases, this threshold becomes even stricter.
Tools like Qodex offer automated detection and analysis of error types during throughput testing. This kind of monitoring helps teams maintain API performance under heavy load and stay ahead of potential issues.
4. Active Concurrent Users
What Are Active Concurrent Users and Why Do They Matter?
Active concurrent users refer to the number of users accessing an API at the same time, which directly impacts resource usage. This is different from the total number of users, as concurrent users perform activities within overlapping timeframes. For example, an app might have 10,000 active users throughout the day, but only 2,000 accessing it concurrently during peak hours.
How to Measure Active Concurrent Users
Tracking active concurrent users requires analytics tools and load testing. A common formula used is:
Concurrent Users = (Average Hourly Sessions × Average Session Duration) / 3600
Behavioral analytics platforms like Google Analytics can help gather this data. Additionally, load tests provide a deeper understanding of user activity during different phases:

Tools like Qodex make it easier to simulate user scenarios and monitor performance metrics.
Why Concurrent Users Matter for API Performance
Understanding active concurrent users helps you gauge how API performance holds up under load. This is especially important in microservices architectures, where different services experience varying levels of demand.
"Consistency in response time is as crucial as speed for APIs. It's not just about how fast the API responds but how consistently it maintains that speed, particularly during peak loads. Inconsistencies may signal hidden issues overlooked by focusing solely on raw speed." – Abstracta Team, Abstracta
Concurrency affects API performance in three main ways:
Server Utilization: A high number of concurrent users can push server resources to their limits, often requiring infrastructure upgrades.
Response Times: Greater concurrency makes it harder to maintain steady response times.
System Stability: Microservices handle workloads differently, so testing the system's overall capacity is crucial.
5. Network Data Transfer Speed
What It Means for API Throughput
Network data transfer speed refers to how much data can be sent from one point to another in a given time. It's usually measured in units like bits per second (bps), kilobits per second (Kbps), megabits per second (Mbps), or gigabits per second (Gbps). Along with RPS (Requests Per Second) and response time, this metric forms a key part of understanding API throughput performance.
How It's Measured
Evaluating network data transfer speed involves specific tools and techniques. Here are some common approaches:

For example, iPerf is a popular tool for pinpointing network bottlenecks. These methods, combined with other throughput metrics, help create a full picture of performance.
Why It Matters for API Performance
Network data transfer speed has a direct impact on API performance in several ways:
Response Time: Faster speeds reduce latency.
Resource Management: Efficient data transfer helps servers run smoothly and avoids bottlenecks.
User Satisfaction: Quick data delivery enhances the overall experience.
"In the digital age, where every millisecond can impact user experience and business outcomes, the efficiency of API data transfers is not just a technicality but a cornerstone of operational success." - Dirk Viljoen, Co-Founder
Tips for Improving Data Transfer Speed
To ensure optimal performance, organizations can:
Use data compression to lower the amount of data being sent.
Implement caching for frequently requested data.
Apply load balancing to handle high data transfer demands efficiently.
Automated tools like Qodex can monitor and maintain data transfer speeds, ensuring they align with API throughput needs.
Throughput in Performance Testing
Conclusion
API throughput testing revolves around five crucial metrics: RPS (Requests Per Second), API Response Time, Error Rates, Active Concurrent Users, and Network Data Transfer Speed. Together, these metrics shape the performance and scalability of your APIs.
Impact on Business Operations
These metrics are not just technical benchmarks - they directly influence business outcomes:

Real-world examples highlight the importance of thorough API testing. For instance, Workday runs about 1,200 API tests per deployment in its CI/CD pipeline, catching critical transaction logic issues before they escalate. Similarly, SalaryBook cut support tickets by 50% while integrating with five new partners, thanks to well-planned API monitoring and documentation.
Best Practices for Implementation
Effective API testing and monitoring can save time and improve efficiency. For example, ComeUp replaced manual bi-weekly reviews with automation, saving 12 hours per sprint. Proactive monitoring helps DevOps teams quickly address problems and maintain service quality.