Load Testing APIs in 2026: Best Tools, Methods & Real-World
Want to ensure your APIs handle heavy traffic without breaking?
API load testing is the key. It helps identify bottlenecks, measure performance, and verify scalability under real-world conditions.
What Is Load Testing in API Performance?
Load testing is the process of simulating real-world traffic to measure how an API performs under expected and peak loads. It helps identify latency, throughput, error rates, and bottlenecks before users experience them. Unlike stress testing, which pushes systems to failure, load testing focuses on ensuring APIs handle normal and slightly above-normal traffic smoothly.
Checkout What is Load Testing
Key Metrics to Track in API Load Testing
When running load tests, track these core performance metrics:
Response Time (RT): Average and 95th percentile response delays.
Throughput (TPS): Number of requests processed per second.
Error Rate (%): Failed requests vs total requests.
Concurrency Levels: Maximum parallel connections supported.
Resource Utilization: CPU, memory, and database usage under load.
Benefits of Load Testing APIs
Effective load testing offers several benefits:
Improved Reliability: Detect bottlenecks before users do.
Scalability Insights: Plan infrastructure for peak usage.
Cost Savings: Optimize cloud resources and avoid over-provisioning.
Compliance & SLAs: Prove API uptime and performance guarantees.
Here’s a quick breakdown of what you’ll learn:
Why Load Testing Matters: Detect issues early, save costs, and ensure reliability.
Key Metrics to Track: Response times, error rates, throughput, and resource usage.
Best Tools for API Load Testing:
Apache JMeter: Powerful, customizable, with distributed testing.
Grafana k6: JavaScript-based, cloud-friendly, and great for monitoring.
Gatling: Detailed reports and CI/CD integration.
Qodex AI: AI-driven, automates test creation and monitoring.
Load Testing Methods and Standards
Creating Test Traffic Patterns
When designing traffic patterns for load testing, aim to mimic how users interact with your system in real-world scenarios. Start with baseline tests to establish performance benchmarks, then layer in patterns that reflect actual usage. Here are some key strategies:
Variable Request Types: Incorporate a mix of GET, POST, PUT, and DELETE requests in proportions that align with real production traffic.
Geographic Distribution: Simulate user requests from multiple locations to account for potential latency variations across regions.
Session Management: Generate unique user sessions to prevent skewed results caused by caching mechanisms.
Warm-up Requests: Include initial requests to address cold starts, especially in containerized environments.
Common Challenges in API Load Testing
Load testing APIs isn’t without hurdles:
Realistic Test Data: Creating datasets that mimic production.
Environment Differences: Staging vs production discrepancies.
Dynamic APIs: Handling tokens, auth flows, and changing endpoints.
Monitoring Overhead: Collecting metrics without skewing results.
Real-World Examples of API Load Testing
E-commerce Checkout APIs: Tested to handle Black Friday spikes of 100K+ concurrent users.
Banking APIs: Simulated 2M daily transactions to ensure compliance and prevent downtime.
SaaS Platforms: Validated API scalability during product launches.
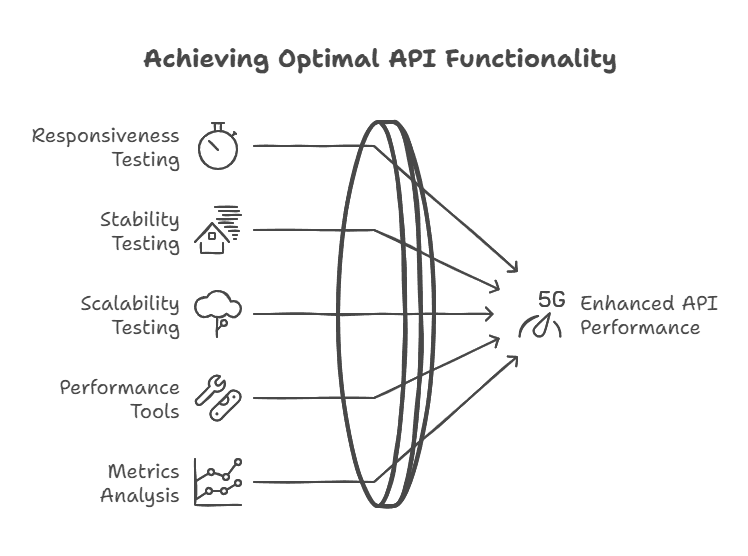
Key Performance Measurements
To get a full picture of your system's performance, focus on these critical metrics:
Metric Category | Key Measurements | Target Thresholds |
|---|---|---|
Response Time | Average, P95, P99 latency | < 200ms average |
Error Rates | 4xx and 5xx responses | < 0.1% of total requests |
Throughput | Requests per second | System-specific baseline |
Resource Usage | CPU, Memory, I/O | < 80% utilization |
Track both client-side and server-side metrics. Pay close attention to areas like database query performance and connection pool usage, as these are frequent bottlenecks under heavy load. Detailed monitoring helps refine your testing approach and ensures your system remains efficient.
Test Cycles and Updates
Once traffic patterns are designed and performance metrics are being tracked, structured test cycles are essential for maintaining reliability over time.
Regular Testing Schedule: Conduct load tests regularly, especially before major releases or anticipated traffic spikes, to catch potential performance issues early.
Version Control: Keep your test scripts in version control alongside your application code. Update these scripts with every API change to ensure they remain accurate.
Continuous Integration: Incorporate basic load tests into your CI/CD pipeline to quickly identify performance regressions after code changes.
For example, you might ramp up from 100 to 10,000 concurrent users over 30 minutes, hold the peak load for an hour, and then scale down. During this process, monitor key metrics like database query times, API latency, and error rates to identify any weak spots. This methodical approach ensures your system can handle demand while staying responsive and reliable.
Getting started with API Load Testing (Stress, Spike, Load, Soak)
Load Testing Tools Guide
This section dives into the standout features of some of the most popular API load testing tools. These tools are designed to take the testing principles discussed earlier and elevate API performance assessments to the next level.
Standout Features of Popular API Load Testing Tools
Qodex.ai Capabilities

Qodex.ai offers a comprehensive API testing and monitoring platform designed for modern development teams. It combines functional, load, and security testing in a single, cloud-native solution. Unlike traditional tools, Qodex.ai provides AI-driven insights that automatically detect performance bottlenecks and suggest optimizations.
Key features include:
Feature | Capability | Benefit |
|---|---|---|
AI-Powered Analysis | Auto-identifies performance issues | Saves time on manual debugging |
Real-Time Monitoring | Continuous API health checks | Detect issues before they impact users |
CI/CD Integration | Works with Jenkins, GitHub, GitLab | Automates testing in development workflows |
Custom Load Scenarios | Simulate complex user behavior | Accurate, production-like performance testing |
Qodex.ai stands out for teams seeking a unified, intelligent approach to API performance testing, making it easier to maintain reliable, high-performing APIs at scale.
Apache JMeter Features

JMeter is a versatile tool that supports a wide range of protocols and offers extensive customization options. Its user-friendly GUI simplifies the process of crafting complex test scenarios. One of its standout features is distributed testing, which allows teams to simulate thousands of users across multiple servers.
What really sets JMeter apart is its vast plugin ecosystem. The JMeter Plugins Manager offers over 70 plugins tailored for specialized testing needs. For instance, the PerfMon plugin provides real-time server monitoring during tests, while the Custom Thread Groups plugin gives teams detailed control over user load patterns.
Grafana k6 Capabilities

Grafana k6 takes a modern approach to API load testing with JavaScript-based scripting, making it a natural fit for development teams familiar with web technologies. Its cloud-based execution enables tests to run across multiple regions, offering real-time insights through Grafana dashboards. Built-in performance thresholds and alerting features add another layer of utility. Key cloud features include:
Feature | Capability | Benefit |
|---|---|---|
Cloud Execution | Up to 100,000 virtual users | Simulate large-scale loads |
Geographic Distribution | 15+ global regions | Test latency from diverse locations |
Results Storage | 30-day retention | Analyze historical performance trends |
Gatling Functions

Gatling uses Scala for test scripting, employing a DSL that simplifies the creation of detailed and complex test scenarios. Its correlation engine automatically captures dynamic values across requests, ensuring accurate performance insights.
One of Gatling's highlights is its detailed HTML reporting. These reports break down response time distributions, request rates, error statistics, and server metrics, giving teams a comprehensive view of API performance.
For teams needing more advanced features, Gatling Enterprise offers distributed test execution, collaboration tools, and seamless integration with CI/CD pipelines. With plugins for Jenkins, GitHub Actions, and GitLab CI, it enables automated performance testing as part of the development process.
Whether you're simulating high user loads or analyzing intricate performance metrics, these tools provide tailored solutions to meet various API testing needs. Each one brings unique strengths to the table, helping teams ensure their APIs remain reliable under pressure.
Qodex.AI Load Testing

Qodex uses artificial intelligence to streamline API load testing, helping teams cover more ground while cutting down on the time and effort typically involved in traditional testing methods.
AI Test Creation
Qodex makes creating test scenarios easy by turning plain English instructions into load testing scripts. Thanks to its natural language processing (NLP) capabilities, team members don’t need advanced scripting skills to set up tests, making the process accessible to everyone, regardless of technical expertise.
The platform’s AI engine works behind the scenes to:
Analyze API endpoints and their interactions
Create realistic test scenarios based on common usage patterns
Automatically update scripts as APIs evolve
Check test coverage against pre-set performance standards
With this AI-driven approach, teams can achieve over 70% test coverage [2]. This automated process not only simplifies testing but also improves performance monitoring.
AI Performance Monitoring
Qodex’s AI-powered monitoring system provides real-time analytics and predictive insights during load testing. By analyzing performance data with advanced algorithms, the system helps teams spot bottlenecks and anomalies early, enabling a proactive approach to managing API performance.
Testing Platform Features
Qodex goes beyond test creation and monitoring by offering a range of features that fit seamlessly into existing development workflows. Key capabilities include:
Cloud and Local Testing
Options for cloud-based or local GitHub testing
Automated test execution across various environments
Secure protocols for testing sensitive APIs
Continuous Integration
Auto-healing tests that adjust to API changes
Smooth integration with CI/CD pipelines
Automated regression testing after updates
Documentation and Reporting
Automatically generated interactive API documentation
Detailed performance metrics and trend analysis
Customizable reporting dashboards to keep stakeholders informed
With enterprise-level features like dedicated support and tailored configurations for large-scale testing, Qodex ensures APIs perform reliably across any environment.
Conclusion
Methods and Tools Overview
API load testing requires a thoughtful combination of reliable tools and effective strategies to ensure your system can handle various traffic levels without compromising performance [1]. To get the best results, it’s essential to:
Clearly define performance benchmarks and acceptable limits.
Incorporate error-handling mechanisms to address potential API overloads.
Continuously track performance metrics that reflect real-world usage.
Best Practices Checklist
Define clear performance goals (response time < 500ms).
Start with baseline traffic before scaling up.
Use production-like datasets.
Test both expected and peak load scenarios.
Continuously monitor and refine infrastructure.
API Load Testing Tools Comparison Table
Tool | Best For | Pricing Model | Unique Feature |
|---|---|---|---|
JMeter | Open-source load testing | Free | Plugin-rich ecosystem |
k6 | Modern DevOps workflows | Free + Cloud | JavaScript scripting |
Gatling | High concurrency simulations | Open-source | Scala-based performance tests |
Loader.io | Quick SaaS-based load testing | Free + Paid | Easy cloud setup |
Postman | API-first testing with monitoring | Free + Paid | Integrated with API lifecycle |
Next Steps
If you're ready to dive into API load testing, start by evaluating your current setup and setting clear performance objectives. Here's a streamlined approach to guide your efforts:
Initial Assessment
Begin by analyzing your API endpoints and identifying performance expectations. Document these requirements and establish baseline metrics for key indicators like response times and throughput. This groundwork will serve as a reference point for future testing.Test Implementation
Use AI-driven testing platforms to automate the creation and execution of test scenarios. Automation not only saves time but also ensures consistent and thorough coverage across all API endpoints, making your testing process more efficient.Continuous Improvement
Schedule regular testing sessions and monitor the data collected from each one. Use these insights to refine your approach and make targeted adjustments to enhance API performance over time.
Keep in mind that API load testing is an ongoing process. Start with straightforward tests and gradually increase their complexity as your application evolves. AI-powered tools can simplify this journey, making it easier for teams - big or small, to implement a scalable and effective testing framework.
Frequently Asked Questions
What exactly is API load testing and why is it important for modern applications?
API load testing is the process of simulating real-world traffic on your application programming interfaces (APIs) to check how they perform under varying levels of load, concurrency, and stress. By executing high volumes of requests over a period of time, you can identify bottlenecks, slow response times, error rates, and resource constraints before they impact users. For modern applications that rely on microservices, serverless functions, cloud deployments or mobile front-ends, performing proper API load testing ensures scalability, reliability and positive user experience. Without it, you risk degraded performance, system failures or poor throughput when real users hit your APIs simultaneously.
What are the key performance metrics you should monitor during API load testing?
When you run API load testing, it’s essential to track metrics like response time (average, P95, P99 latency), error rates (percentage of 4xx/5xx responses), throughput (requests per second) and server resource usage (CPU, memory, I/O). Monitoring these metrics gives you a clear picture of how your API behaves under load, whether it meets your performance goals, and where the weak links are. For example, if your average response time is under 200 ms but the P99 latency jumps above one second under load, you know there’s a performance degradation that needs attention. Using these data points helps you optimize throughput, reduce errors and improve overall system robustness.
Which tools are recommended for API load testing and how do you choose the right one?
When selecting an API load testing tool, you should look at capabilities such as scripting flexibility, distributed testing support, cloud or on-premise execution, real time dashboards and integration with CI/CD pipelines. Popular tools include Apache JMeter (widely used for many protocols and advanced thread group customization), k6 by Grafana Labs (JavaScript-based and cloud friendly), Gatling (good for detailed reporting and CI/CD workflows) and AI-driven platforms like Qodex AI (which can automate test scenario creation). The right tool depends on your team’s scripting expertise, scale of load you need to simulate, integration needs and budget. A proper tool selection ensures effective load testing, accurate results and actionable insights.
How do you design realistic test traffic patterns for API load testing?
Designing realistic traffic patterns means you model scenarios that mirror how actual users interact with your system, such as mixing GET, POST, PUT, DELETE requests, simulating concurrency from different geographic regions, managing unique user sessions, and including warm-up requests to cover cold-start behaviour. A baseline test establishes system behavior under normal load, then ramping up traffic and holding peak load for a time helps reveal how your API handles stress. You may also simulate spikes, steady increases (soak testing), and distributed traffic to test latency and throughput under diverse conditions. Good traffic design ensures your API load testing results reflect real-world performance and expose bottlenecks you might not otherwise catch.
What are common mistakes to avoid when implementing API load testing in your development cycle?
A common mistake is running load tests only once rather than integrating them into your regular CI/CD pipeline, which means you may miss regressions as your API evolves. Another misstep is relying solely on average response time without looking at latency percentiles (like P95 or P99) or error distribution, which can mask serious performance issues. Failing to update test scripts when your API changes is also risky, since outdated scenarios lead to misleading metrics. Additionally, not simulating realistic user sessions, geographic distribution or warm-up behavior may create a false sense of performance readiness. Avoiding these pitfalls helps ensure your API load testing stays relevant, accurate and actionable.
For advanced users: how can you integrate API load testing into a mature DevOps pipeline and ensure continuous performance monitoring?
For teams operating at a higher maturity level, integrating API load testing into your DevOps pipeline means automating test execution as part of your build or deployment workflow, capturing and storing performance data over time and setting alerts when performance thresholds are breached. You should version control your test scripts alongside application code, automatically execute baseline and stress tests before major releases and feed results into dashboards for analysis. Advanced setups may use distributed execution across global regions, compare historical metrics to detect performance drift, incorporate auto-healing test scripts and leverage AI-powered insights to predict bottlenecks. By embedding API load testing within the continuous delivery process and coupling it with robust performance monitoring, you ensure your APIs remain scalable, resilient and performant as usage grows.