HAR File Viewer: Inspect Network Requests
Open a .har file and inspect it in your browser. Filter the request table, read the waterfall and the details, copy a curl command with credential headers and the body omitted by default, or export a partially redacted HAR.
- Open your HAR file. Drag in a .har export or choose it from your device.
- Find the request. Filter by URL, method, status or type, then sort by time or size.
- Inspect or export. Open the details, copy a curl command with credential headers and the body omitted by default, or export a partially redacted HAR and review it before sharing.
How to inspect and partially redact a HAR file
Drop a .har file into the viewer above and you get a summary, a filterable table, a shared waterfall and a detail pane for any request. The HAR is processed in your browser and is not sent to a server, and the tool does not run captured requests.
What Is a HAR File?
A HAR file is a JSON record of HTTP traffic: one entry per request, carrying the method and URL, the headers, cookies, the query string, the timing phases, the sizes and, when the capture kept them, the bodies. Chrome, Edge, Firefox and Safari export HAR 1.2-shaped files from their network panels, and Playwright can record one for a test run.
The format is HAR 1.2, described in a document hosted at the W3C: an abandoned 2012 draft which labels itself "DO NOT USE" and was never published as a standard. The browsers above write to it anyway, so it is the de facto object model and it is what this viewer parses.
Treat a capture as sensitive by default. Session cookies, bearer tokens, personal data inside a response body and internal hostnames all land in the file, which is why pasting a raw HAR into a ticket is a bad habit and why this tool has a partially redacted export.
How This HAR File Viewer Works
The file is read by a worker inside this tab. It keeps the parsed document and hands the page what it needs to draw: the summary, the rows, the filter values, one detail object at a time, and the export JSON when you build one. The HAR is processed in your browser and is not sent to a server. The tool does not run captured requests, call the API or fetch external references.
Parsing tolerates what real exports leave out and refuses plainly when it has to: a file that is not JSON, one with no log.entries array, an empty entries list and one over the size limit each get their own message.
Above the table sits the summary: how many requests, how many bytes transferred, how many failed, how long the session lasted, and how many sizes went unrecorded. Under it the filters narrow by URL text, method, resource type, domain and status class, including a failed class that catches a status of 0 alongside 4xx and 5xx. Sorting works on start time, total time, transfer size, status or host.
How to Read the Table, Waterfall and Details
Each row shows the method, the host and path, the status, the resource type, the transfer size and the total time. Transfer size is the bytes on the wire: the capture's own field when the browser wrote one, header plus body sizes otherwise.
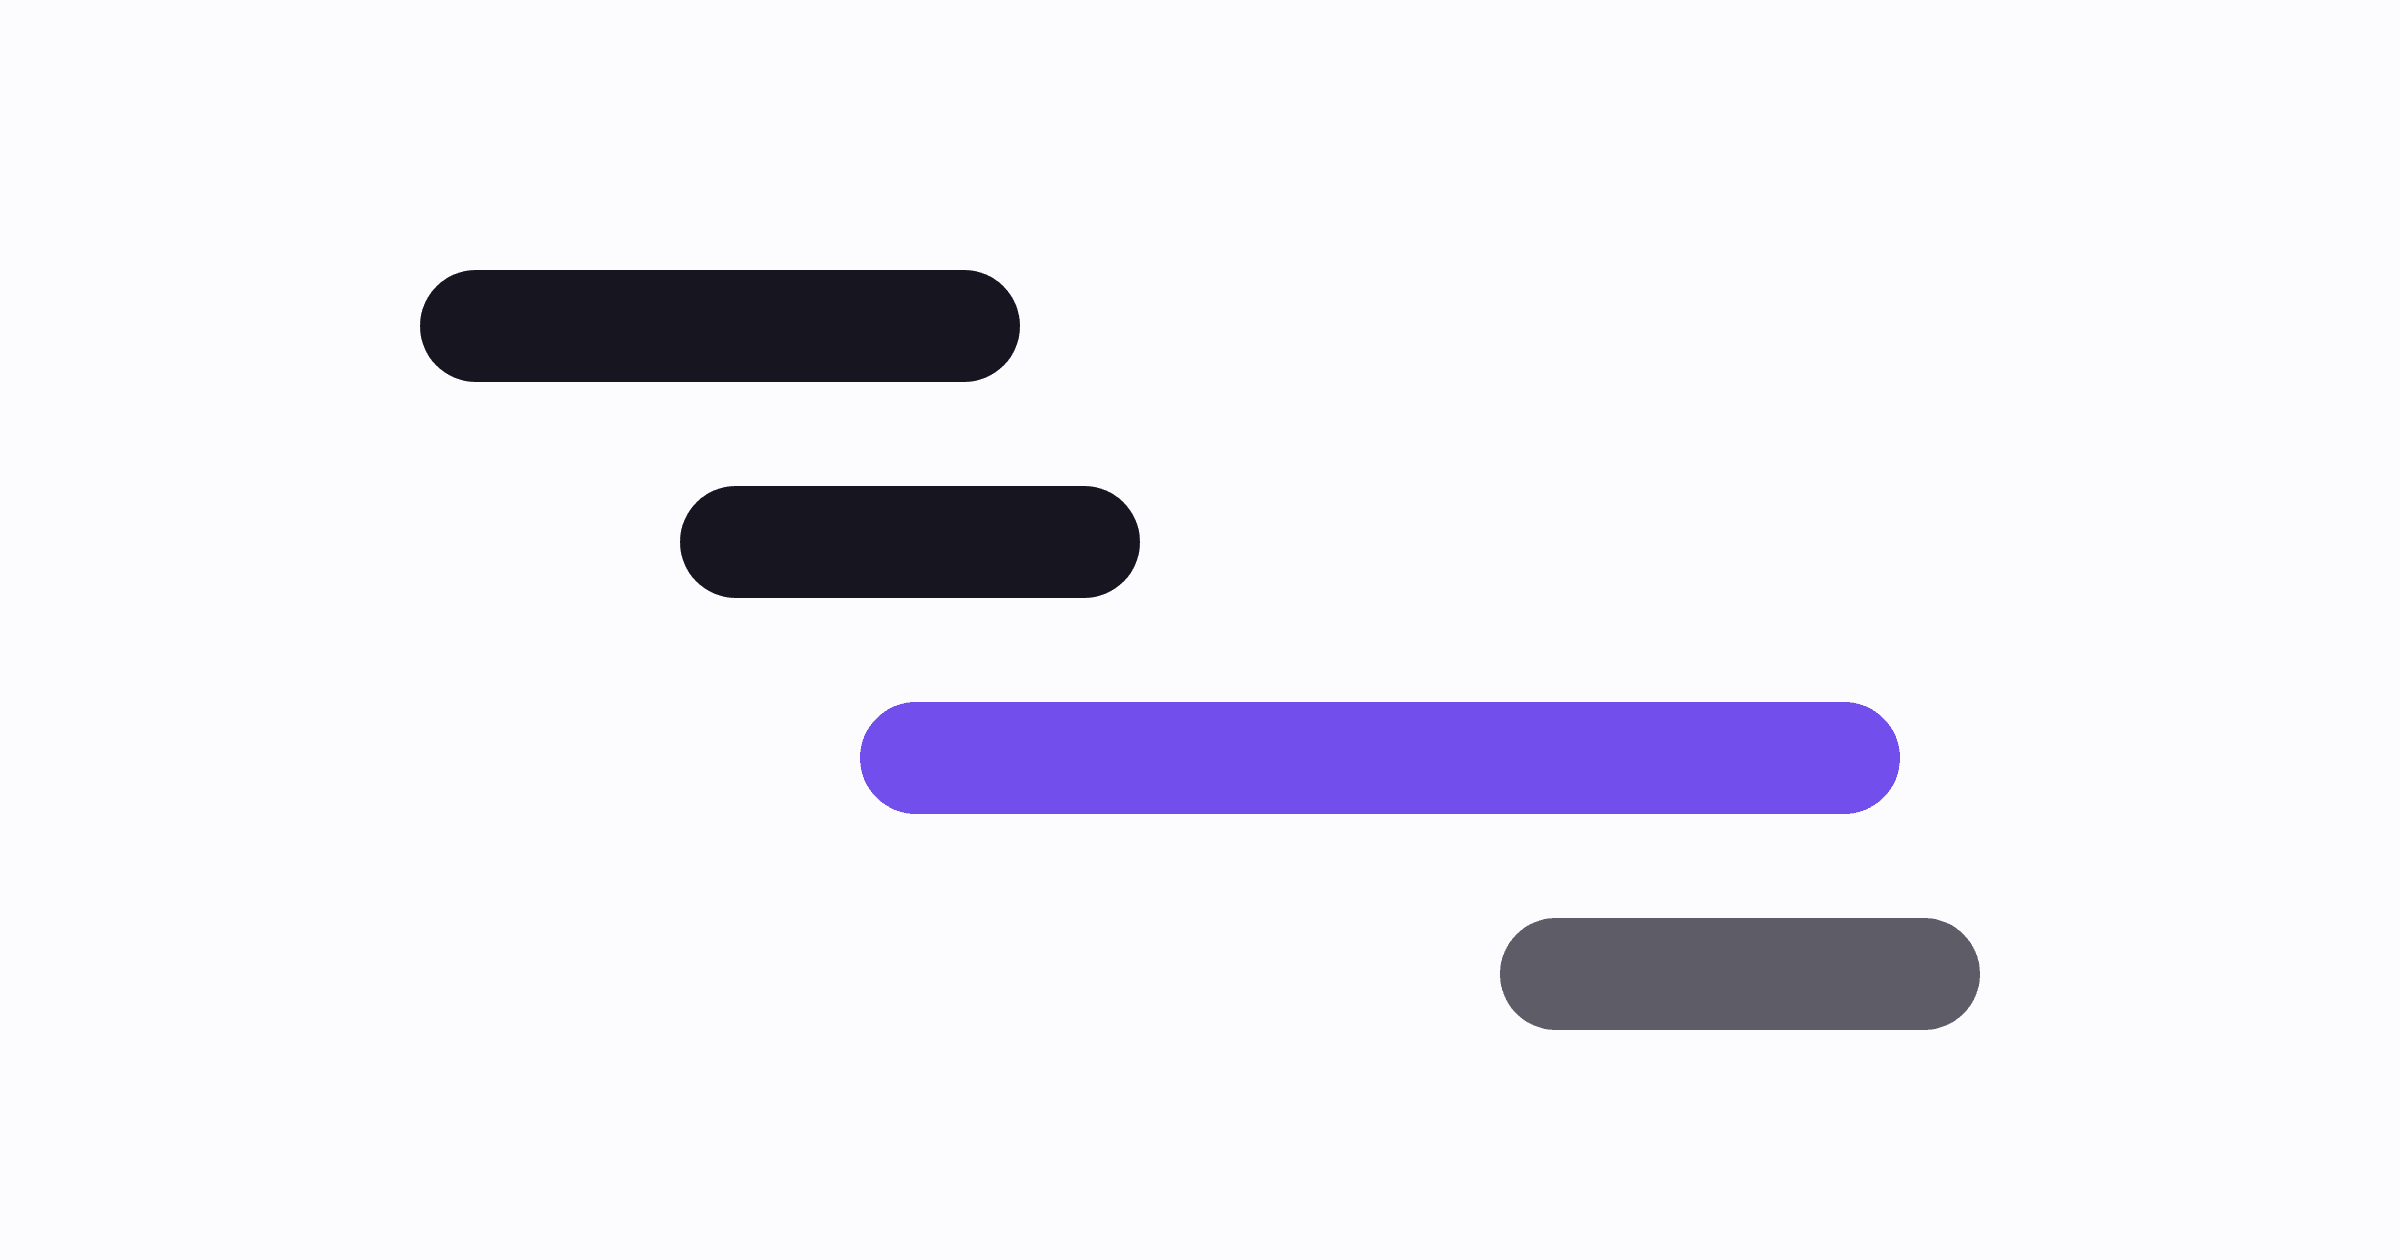
The waterfall places each request by the moment it started, never by stacking durations end to end, because requests overlap and a sum of durations is longer than the session was. The summary's session length is measured the same way, from the first start to the last finish.
Open a request and the detail pane splits its time into the HAR phases: blocked, DNS, connect, send, wait and receive, with SSL shown separately because it sits inside connect and must not be counted twice. Wait is the time to the first response byte, so it holds network latency as well as server processing; receive is the bytes arriving. Beside them are the headers, cookies, query string, the request body if the capture kept one, and the response body when it is present and not base64.
Worked Example: Isolate a Slow Failing API Call
Load the sample capture. The summary reads 6 requests, 144.3 kB transferred, 1 failed, across a 2,260 ms session.
Set the type filter to xhr and sort by time, descending. Two rows are left:
POST  200  1.84 s  538 B  https://api.example.com/v2/cart/quote?currency=EUR
GET   503  88 ms   256 B  https://api.example.com/v2/recommendations?sku=SKU-118
The quote is the slow one. Open it and the phases read blocked 1 ms, send 1 ms, wait 1,790 ms, receive 48 ms, with DNS and connect unknown because the connection was reused. Most recorded time is in wait rather than receive, 97 percent of the 1,840 ms; the HAR alone cannot separate server processing from network latency.
Copy it as curl, comment lines included:
# Omitted 2 credential headers: authorization, cookie
# Request body omitted. Turn on "include body" to copy it.
# This entry records 1 cookie and no Cookie header. They are left out. Turn on "include credential headers" to send them.
curl -X POST 'https://api.example.com/v2/cart/quote?currency=EUR' \
  -H 'content-type: application/json'
Paste that into a ticket without handing over the bearer token or the session cookie. Every omission is named rather than silent, so nobody runs it and wonders why it answers 401. The URL is unchanged, so read the command before you share it.
Limits and Partial Redaction
The size limit is 150 MB, measured rather than guessed: the retained object runs about 1.7 times the file size, which is where a tab stops being comfortable. The panel notes that files above 40 MB may take a moment to read, because the parse blocks the worker. The table holds up to 20,000 rows while the summary above it still counts every request in the file, and header and cookie lists are capped at 400 items. A body in the detail pane is trimmed at 256 kB and an export that includes bodies carries at most 32 MB of body text, both counted in encoded bytes rather than characters, and the tool says how many bodies it left out.
Missing data stays missing. A size or a timing phase of -1 means the browser did not record it, and the viewer shows unknown instead of zero. Bodies are optional in the format, so a request can show headers and timings with no payload, and a base64 body is reported rather than decoded.
The export builds a new file from an allowlist, never from a list of secret names, because a deny list is wrong the first time somebody names a token x-thing-id. It keeps the start time, timings, method, HTTP version, sizes, status, the response MIME type, and the URL without its user info, query string and fragment, plus six headers: accept, accept-encoding, cache-control, content-encoding, content-length and content-type. It drops cookies, query parameters, redirect URLs, server IP, connection ids, comments and custom fields, and bodies unless you turn them on.
It is still called partial redaction, and the exported file says so in its own creator comment and in its name, which ends in -partially-redacted.har. A host and a path identify a customer or a resource on their own, so review the export before you share it. The file you loaded is never modified.
When to Move From a HAR to Automated Tests
A HAR is one session that already happened, on one machine, with one set of credentials. It is the right tool for reading what went out and what came back, and the wrong one for knowing whether it still works tomorrow. Move to tests when you need assertions on the response, a run per environment, coverage of roles rather than one signed-in user, or evidence you did not reproduce by hand. Our guides to Playwright performance testing, API fuzz testing and writing test cases each cover a piece of that.
Import a spec, a Postman collection, a spreadsheet, or one sentence. Runnable scenarios, run against every PR preview, replayed. Describe the flow in a sentence and Qodex drives the real app, brings back a screenshot of what broke, and saves the run as Playwright you own.
Turn a captured flow into tests, or see how Qodex API testing works.
Frequently Asked Questions
What is a HAR file?
A JSON record of HTTP traffic, one entry per request, holding the method and URL, headers, cookies, query string, timing phases, sizes and sometimes the bodies. Browsers export one from their network panel, and Playwright can record one for a test run. The format is HAR 1.2.
Is my HAR file uploaded?
No. The HAR is processed in your browser and is not sent to a server. The tool does not run captured requests, call the API or fetch external references. A worker inside this tab keeps the parsed document and hands the page the summary, the rows, one detail at a time and the export JSON.
How do I export a HAR from Chrome, Edge, Firefox or Safari?
Open the browser's network panel first, then reproduce the problem so the capture covers it. Each of the four has an export or save control in that panel which writes a .har file, usually next to the clear and filter buttons. Then drag the file into the viewer on this page.
Why are some response bodies or sizes missing?
Because both are optional in the format. Browsers leave bodies out for large or binary responses and when the capture was saved without content, so a request can show headers and timings with no payload. A base64 body is reported rather than decoded, and a size of -1 shows as unknown.
What does -1 mean in HAR timings?
That the phase was not measured or does not apply, for example DNS and connect on a reused connection. The viewer shows it as unknown and never counts it as zero, which is why a phase breakdown can add up to less than the total time. SSL sits inside connect, so it is not added twice.
Does copy as curl include cookies or authorization headers?
No. By default, Authorization, Cookie, Proxy-Authorization, Set-Cookie and token-like headers are omitted, along with the request body. Cookies stored in the HAR cookie list are omitted too. You can opt in to credentials or the body. Comments name each omission, but the URL is unchanged, so review the command before sharing or running it.
What does partially redacted mean?
The export is a new file built from an allowlist: the start time, timings, method, HTTP version, sizes, status, response MIME type, the URL without its query string, and six ordinary headers. Everything else is dropped. It stays partial because hosts, paths and timing data can identify a customer on their own.
Can this viewer replay requests or replace automated tests?
It replays nothing at all. A HAR is one session that already happened, so reading it tells you what went out and what came back, not whether it still works tomorrow. Assertions, roles, environments and a run on every pull request all belong to a test suite instead.
Related Articles

Turn one captured session into tests that run on every pull request
Import a spec, a Postman collection, a spreadsheet, or one sentence. Qodex writes runnable scenarios, runs them against every PR preview, and replays them.