Shift Left vs Shift Right: A Practical Comparison
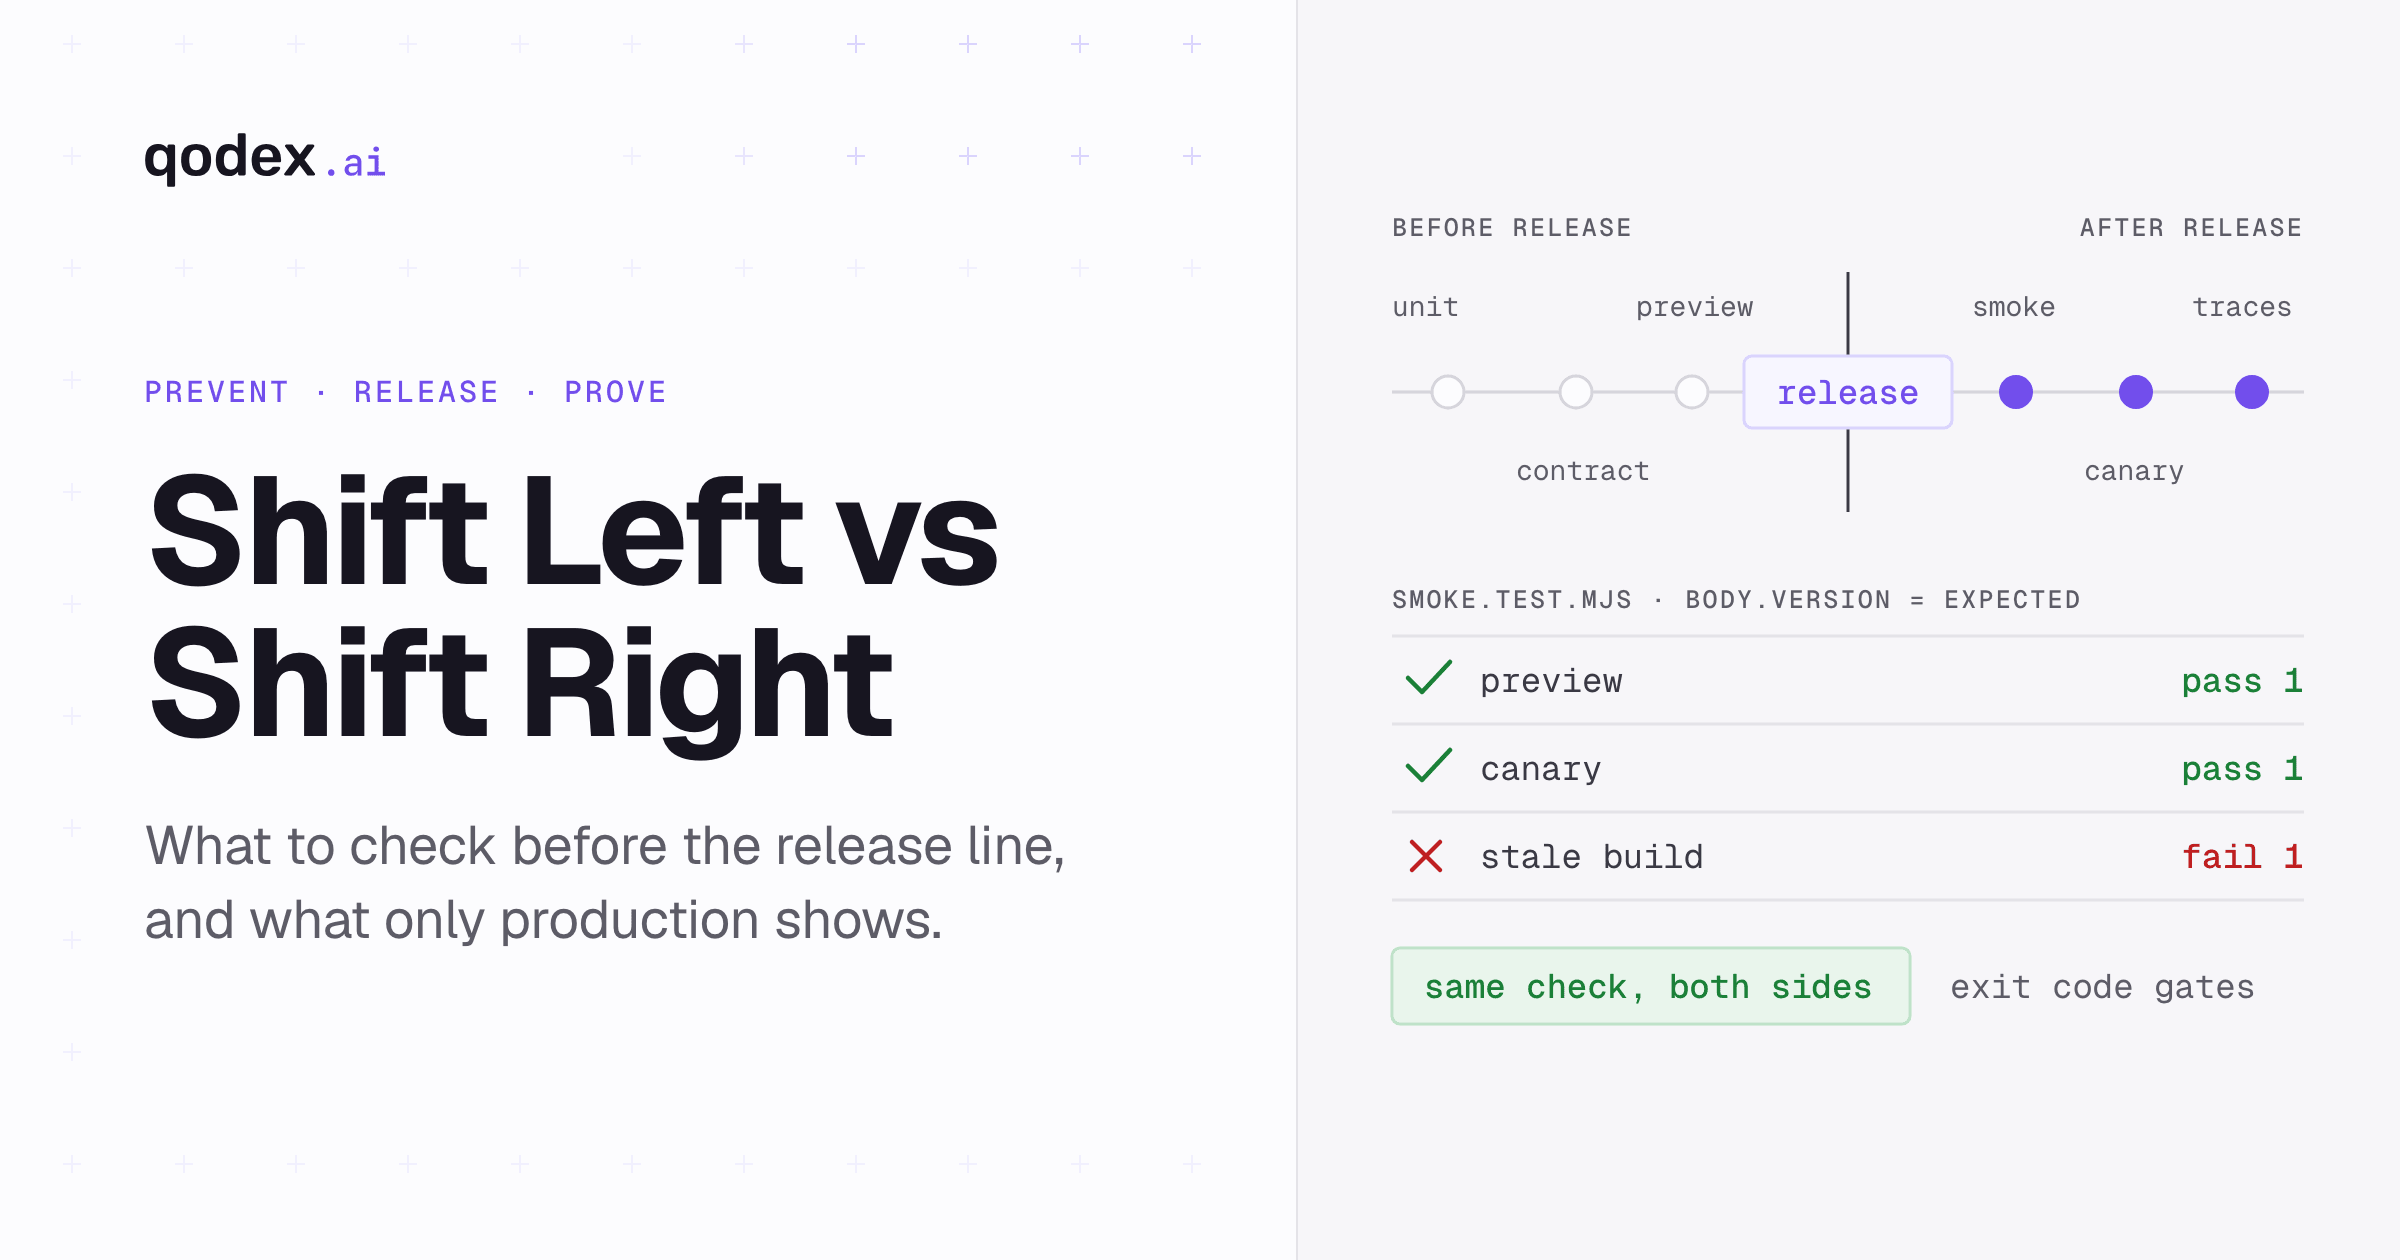
Shift-left testing moves feedback into planning, coding, and pre-merge checks so teams prevent defects before release. Shift-right testing validates the running system with production telemetry, controlled rollouts, synthetic checks, and real-user evidence. They are complements, not alternatives: use the left to stop known, reproducible risks early, and the right to catch environment, scale, resilience, and behavior problems that only appear after deployment.
Qodex covers both sides of that loop: it runs API, UI, and security tests on every pull request and again on every deploy. See Qodex API testing.
Shift left vs shift right at a glance
Each row is a decision you make: what each side does about it, how to run both, the measure, and what a failure does to the release.
| Decision factor | Shift left | Shift right | Combine them by | Primary measure | Failure action |
|---|---|---|---|---|---|
| Timing | Before merge | After deploy | One suite, two triggers | Feedback time | Left blocks, right rolls back |
| Goal | Prevent known defects | Observe real behavior | Turn findings into tests | Escape rate | Fix the cause once |
| Environment | Local, CI, preview | Canary, then production | Same scenarios, safe data | Parity gaps | Fix parity, not the test |
| Feedback source | Tests and analyzers | Telemetry and users | One queue for both | Signal to noise | Triage by user impact |
| Functional correctness | Unit and component tests | Synthetic journeys | Promote journeys left | Pre-merge failure rate | Block the merge |
| API and contract risk | Contract tests | Live schema checks | Share one spec | Contract breaks caught | Block, then version |
| Security | SAST, secrets, dependency scans | Runtime probes and logs | One finding backlog | Findings by stage | Block on critical |
| Performance | Budgets in CI | Latency and saturation | Same thresholds both sides | p95 latency | Hold promotion |
| Resilience | Fault injection in tests | Controlled experiments | Start in preview | Recovery time | Stop the rollout |
| User experience | Accessibility and layout | Real-user monitoring | Watch the same flows | Error and drop-off | Flag off the change |
| Typical practices | Review, analysis, unit, contract | Canary, flags, synthetics, chaos | One release checklist | Critical-path coverage | Named owner acts |
| Owner | Developers, with QA | Developers, with SRE | One shared scorecard | Time to owner | No handoff queue |
| Feedback speed | Minutes | Minutes to days | Alert on both | Median and p95 | Page only on impact |
| Main blind spot | Real traffic and scale | Cheap, reproducible bugs | Cover each with the other | Defects found by stage | Move the check left |
| Release response | Do not merge | Roll back or flag off | Pre-agreed criteria | Rollback rate | Decide before you ship |
"Left" and "right" describe where feedback sits on the timeline from idea to live system, not two teams or two budgets. The same developer writes the contract test that blocks the merge and reads the trace that shows the canary misbehaving. Red Hat frames both as continuous testing across the lifecycle, not competing methods. Source: Red Hat, shift left vs shift right, read 19 September 2026.
What shift-left testing means
Shift left means moving testing, quality checks, and performance evaluation earlier, sometimes before any code is written. Source: Dynatrace, shift left vs shift right, read 19 September 2026. The practical test of whether a team has shifted left: how long after a mistake does someone find out?
The left side is a stack of checks, each aimed at a risk you can reproduce without real users.
Requirements and design review. Ambiguity is a defect nobody has written yet. An acceptance criterion two people read differently produces a bug and an argument about whether it is one. Turn each criterion into an assertion first.
Static analysis and secret scanning. Linters, type checks, and scanners find unsafe patterns, vulnerable dependencies, and committed credentials without running anything.
Unit and component tests. Isolated logic is where a failing test points straight at a line, so branching rules and error handling are cheapest to pin down here.
Contract tests. A service that renames a field breaks its callers. A contract test in the provider's pipeline catches that before the consumer's build does.
Integration tests. Two components that each pass alone can still disagree about ordering, retries, or timeouts.
Security checks. Known weakness classes, authorization boundaries, and input handling, probed against a preview on the pull request with no production exposure.
Early performance checks. A budget on a hot endpoint catches an accidental query in a loop while the change is still one commit.
That list follows BrowserStack's catalog of left-side practices, sorted by the risk each one addresses. Source: BrowserStack, shift left vs shift right, read 19 September 2026.
The limit of the left side is scope. Every check here runs against an environment you built, with data you chose, at a scale you decided. It cannot tell you that a payment provider slows down under the load of a real peak, or that the feature works and nobody uses it.
Security shows plainly that prevention alone is not a strategy. NIST's Secure Software Development Framework, SP 800-218 version 1.1, published February 2022, organizes secure development into preparing the organization, protecting software, producing well-secured software, and responding to vulnerabilities. That fourth group exists because vulnerabilities are found after release. Source: NIST SP 800-218, read 19 September 2026. It is guidance, not a certification, and running its practices does not prove compliance with anything.
If you need the implementation plan rather than the comparison, use our shift-left testing strategy.
What shift-right testing means
Shift right performs the same quality and performance work in production, under real-world conditions. Source: Dynatrace, read 19 September 2026. It answers a question the left side cannot: what does this system do with real people, real data volumes, real dependencies?
Observability. OpenTelemetry lists traces, metrics, logs, and baggage as its signals: a trace is the path of a request, a metric a runtime measurement, a log a record of an event. Source: OpenTelemetry signals, read 19 September 2026. These signals are what tell you where a request spent its time and which component answered badly, so the checks below have something to read.
Service level objectives. "Service level objectives (SLOs) specify a target level for the reliability of your service." Source: Google SRE Workbook, Implementing SLOs, read 19 September 2026. A good indicator is user-centered: successful requests over total requests, or requests faster than a threshold over total requests.
Synthetic checks. A scripted journey runs on a schedule against the live system and tells you a critical path broke before a customer does.
Real-user monitoring. Field data on errors, latency, and completion rates, gathered from the devices and networks your users actually have rather than from the ones you chose for the test lab.
Feature flags. Deploying code and releasing behavior become two events, so a bad feature is switched off without a redeploy.
Canary and blue-green releases. A canary deployment is a progressive rollout that splits traffic between the deployed version and the new one, exposing a subset of users before rolling out fully. Source: Google Cloud Deploy, canary deployment strategy, read 19 September 2026.
Controlled resilience experiments. Injecting a dependency failure on purpose, with a chosen blast radius and a stop condition written first, tells you whether the fallback works.
Three safety rules apply to every check in that list. Keep production requests read-only wherever you can. Use a dedicated synthetic identity when authentication is required, never a real customer's account. Never change real customer data. BrowserStack states the same rule: production verification should be brief, safe, and designed not to alter real customer data. Source: BrowserStack, read 19 September 2026.
Shift right is not a licence to skip cheap checks. A defect a unit test would have caught before merge is not better found by a production incident.
When to use each approach
The useful question is not "are we a shift-left shop or a shift-right shop". It is "where can this risk be observed". Answer that per risk and the split decides itself.
Lead with the left when the risk is reproducible. Wiz makes the same split: prevention before deployment, detection and response after it. Source: Wiz, shift left vs shift right, read 19 September 2026.
Correctness. Business rules, calculations, validation, state transitions. If you can write the input and the expected output, run it before merge.
Interface and contract risk. Request and response shapes, status codes, field types, pagination, error bodies.
Known security weakness classes. Injection, broken object-level authorization, missing function-level checks, leaked secrets, vulnerable dependencies.
Cheap performance assumptions. An N+1 query, a missing index, an unbounded response. A budget assertion catches these without production traffic.
Lead with the right when the risk only exists in the real system.
Environment and configuration. Certificates, DNS, secrets, region differences, cloud quotas. Properties of the deployment, not of the code.
Traffic and scale. Concurrency, cache behavior under real key distribution, connection-pool exhaustion, third-party rate limits.
Rollout risk. A migration that is fine at rest and painful mid-deploy, or a change that breaks only sessions started on the old version.
Resilience. What happens when a dependency times out, returns garbage, or comes back slowly after a restart.
User behavior. Whether people find the feature, finish the flow, and come back.
For a system with real users and real dependencies the answer is both, but not the same check in both places. Duplicating your unit suite as a production synthetic buys noise, not confidence. A check belongs on the right only if its failure tells you something the left-side version could not, and belongs on the left as soon as you can write it down as a reproducible case.
Team shape changes the order, not the destination. A team with no observability buys traces and one SLO before chaos engineering. A team with a mature pipeline and a weekly production surprise has a right-side gap, not a coverage gap.
For the pipeline design, see continuous API testing in CI/CD. For security-specific checks on both sides of deployment, use the API security testing guide.
How teams combine shift left and shift right
The combination is not a ratio. It is a loop with five steps, and the value comes from the loop closing, not from any single step.
Step one: the right side produces a signal. An SLO burns faster than expected, a canary shows a higher error rate than stable, a synthetic journey fails at the payment step, or a trace shows one downstream call eating the request budget. You have a symptom and a timestamp, not a bug.
Step two: the signal becomes a reproducible case. This is the step that gets skipped, and skipping it is how the same incident comes back. Turn the failing request, the response, and the conditions into a test that fails on a branch. If you cannot reproduce it, the fix is a guess.
Step three: the test moves left. Put it at the cheapest level that still catches the problem. A malformed downstream response is a unit test with a stub. A field that disappeared is a contract test. A flow that breaks only end to end is an end-to-end test, and those stay few. See what end-to-end testing covers and building an effective regression test suite.
Step four: deployment stays controlled. The fix ships behind the same machinery as everything else: a flag you can switch off, a canary that takes a slice of traffic first, written promotion criteria. "The canary looks fine" is not a criterion. A criterion names the indicator, the tolerance against the stable version, and the window. Set all three from your own service level objectives: error rate within an agreed margin of stable, p95 latency inside the objective, held long enough to see real traffic. Written that way it can be evaluated without a meeting.
Step five: the right side confirms the fix. The measure that raised the alarm clears it. If the SLO recovers and the canary passes its criteria, promote. If not, roll back and return to step two.
Three things make the loop work. One backlog, so a production finding and a failing test get the same triage. Shared measures, so developers read production dashboards and SRE reads the pre-merge failure rate. And a written decision table, agreed before an incident, so the question in the moment is "what did we decide" and not "who decides".
The combined model is part of a wider holistic software testing strategy, and CI/CD testing is the machinery that carries it.
What to measure on each side
Each side answers a different question, so each needs its own measures, plus a shared set that stops the two being optimized against each other.
Left-side measures: how fast a mistake becomes visible, and how much gets past you.
Commit-to-feedback time, median and p95. The median says what a normal wait looks like. The p95 says what the slow tail looks like, which is the wait where people stop waiting and start context-switching, so read both.
Pre-merge failure rate. Both ends are signals to investigate, not verdicts. Near zero is worth checking: either the code arrives clean or the checks are not exercising much. Very high is worth checking too: either the change is risky or the branch has become the test environment.
Defects found by stage. Review, unit, integration, preview, production. That distribution is the honest picture of your left side.
Flaky-test rate. A suite people rerun until it passes is not a gate. Track reruns that change the result, and quarantine rather than ignore.
Escape rate. Defects that reached production and had a reproducible pre-merge case.
Right-side measures: what users actually experienced.
SLO attainment and error-budget burn. The budget turns reliability into a decision: when it burns, the next change is a fix, not a feature.
User-visible error rate and latency. Measured from the user's side, not from the service's own success counter.
Incident frequency and time to detect. Detection time separates "our monitoring found it" from "a customer found it".
Canary rollback rate. A rising rate is a signal to investigate the left side, because something reproducible is reaching the canary. A long run of zero is also worth a look: it can mean the left side is working, or that the promotion criteria are too loose to reject anything.
Failed deployment recovery time. How long it takes to recover from a deployment that needs immediate intervention.
Shared measures. DORA names five software delivery performance metrics in two groups. Throughput uses change lead time, deployment frequency, and failed deployment recovery time. Instability uses change fail rate and deployment rework rate. Source: DORA software delivery performance metrics, read 19 September 2026.
DORA's cautions matter as much as the list. It says these factors are best suited to measuring one application or service. It adds that measuring a complex system with a single metric goes wrong, and that setting a metric as a goal invites teams to game it. It also reports that "speed and stability are not tradeoffs", and that the metrics are correlated for most teams. So keep them at application or service level, review them as a set, and never turn one into a quota. The scorecard above is a synthesis of DORA and the Google SRE guidance, not a standard either publishes.
Runnable example: one smoke test, two release decisions
Here is the whole comparison in one file: the same check on both sides of the deploy, with only the target and the consequence changing. Save it as smoke.test.mjs. It needs Node's built-in test runner, global fetch and AbortSignal.timeout, which means Node 18 or newer. In our run it was Node 26.9.0.
Every value in it belongs to the service, not to this page. The latency budget, the request timeout, the expected status code and the shape of the health body are all yours to set from your own service level objectives and your own contract. The pipeline passes in BASE_URL and EXPECTED_VERSION. The latency budget and the request timeout use the defaults in the file unless you override them the same way.
import { test } from 'node:test';
import assert from 'node:assert/strict';

// All three come from the pipeline. Set the budget from your own objective.
const BASE_URL = process.env.BASE_URL;
const EXPECTED_VERSION = process.env.EXPECTED_VERSION;
const BUDGET_MS = Number(process.env.SMOKE_BUDGET_MS ?? 1500);
const TIMEOUT_MS = Number(process.env.SMOKE_TIMEOUT_MS ?? 5000);

test('health endpoint answers with the contract we promise', async () => {
  const started = Date.now();
  const response = await fetch(`${BASE_URL}/api/health`, {
    method: 'GET',
    headers: { accept: 'application/json' },
    signal: AbortSignal.timeout(TIMEOUT_MS),
  });
  const elapsed = Date.now() - started;

  // Status, content type and body shape are this service's contract. Change them to yours.
  assert.equal(response.status, 200);
  assert.match(response.headers.get('content-type') ?? '', /application\/json/);

  const body = await response.json();
  assert.equal(body.status, 'ok');
  assert.equal(body.version, EXPECTED_VERSION);
  assert.ok(elapsed <= BUDGET_MS, `took ${elapsed}ms, budget ${BUDGET_MS}ms`);

  console.log(`${BASE_URL} ok in ${elapsed}ms, version ${body.version}`);
});
Run it twice, against two different deployments, passing the version the pipeline just built:
BASE_URL="$PREVIEW_URL" EXPECTED_VERSION="$BUILD_VERSION" node --test smoke.test.mjs
BASE_URL="$CANARY_URL" EXPECTED_VERSION="$BUILD_VERSION" node --test smoke.test.mjs
Both runs print the console line and a summary. Trimmed to the result lines, they look like this:
http://127.0.0.1:4501 ok in 22ms, version 2026.09.19-1a2b3c
tests 1
pass 1
fail 0

http://127.0.0.1:4502 ok in 22ms, version 2026.09.19-1a2b3c
tests 1
pass 1
fail 0
Point the second run at a target still serving the previous build and the assertion does its job. The run exits non-zero, which is the signal your deployment system reads:
AssertionError [ERR_ASSERTION]: Expected values to be strictly equal:
    actual: '2026.09.18-0z9y8x',
    expected: '2026.09.19-1a2b3c',
    operator: 'strictEqual',
tests 1
pass 0
fail 1
The file is identical in both runs. The decision attached to it is not.
Against the preview, it is a left-side check. A failure means the pull request does not merge. The environment is disposable, the data synthetic, and the cost of being wrong is a developer waiting a few minutes.
Against the canary, it is a right-side check. The test itself only exits non-zero. Your deployment system is what reads that exit code, holds the promotion and triggers the rollback, so wire the step that way or nothing happens. The environment is real, some traffic is already on the new version, and the cost of being wrong is counted in affected users.
The version assertion is what makes the canary run worth anything. Comparing body.version with the version the pipeline just built proves you are talking to the build you think you are. Asserting only that the field is a string would pass against a stale deployment, which is the failure mode that makes people distrust production checks.
The canary run is covered by the three production-safety rules in the shift-right section above: read-only requests, a synthetic identity for authentication, and no writes to real customer data. The latency budget belongs in the same assertion, because a health endpoint that answers correctly but far outside its budget is a failing health endpoint.
Common mistakes
Testing everything early. End-to-end suites and full performance runs on every pull request make the pipeline slow and flaky, and people start skipping it. Keep the left side fast and put expensive checks on a schedule.
Testing only in production. Shipping to find out, when a unit test would have answered in seconds, spends user trust on information you could have had for nothing.
Alerts nobody acts on. An alert that changes no decision is noise, and noise trains people to ignore the one that matters. If nothing happens when it fires, delete it or attach an action.
Canaries with no rollback criteria. A canary you watch is a rollout with extra steps. Write the numbers and the observation window before the release, so promotion is evaluated rather than argued.
Separate scorecards for Dev and Ops. When one group owns speed and the other owns stability, each optimizes against the other. One shared set of delivery measures, read together, removes the trade.
Conclusion
Shift left is prevention: catch what can be reproduced, before it ships. Shift right is evidence: see what the running system does with real traffic, and keep the blast radius small while you look. Neither is a strategy alone. Pick the side by where the risk can be observed, connect them so production findings become tests, and measure both with one scorecard.
Frequently Asked Questions
What is the main difference between shift left and shift right testing?
Timing and evidence. Shift left moves checks into planning, coding, and pre-merge stages, so defects are prevented before release. Shift right validates the deployed system with telemetry, controlled rollouts, synthetic checks, and real-user data. Left-side checks run against an environment you control. Right-side checks run against the real thing, where production traffic, production scale, production configuration, and real user behavior are what the system meets.
Are shift left and shift right opposites?
No. They cover different risks. The left side stops known, reproducible defects cheaply. The right side detects behavior pre-production cannot reproduce: load patterns, third-party latency, how people really use a feature. Red Hat treats both as parts of continuous testing across the lifecycle. Source: Red Hat, read 19 September 2026.
Is shift-right testing the same as testing in production?
It includes validating in production, but the responsible version is narrower than "test in production". You expose the change gradually with a canary or a flag, watch agreed indicators, and hold written criteria for promoting or rolling back. The production-safety rules above apply throughout. It is not permission to put an unchecked change in front of every user.
Which tests should run before merge and after deploy?
Before merge: static analysis and secret scanning, unit and component tests, contract tests, focused integration tests, security probes against the preview, performance budgets. After deploy: synthetic journeys, real-user monitoring, SLO and error-budget tracking, canary comparison against stable, controlled resilience experiments. A few checks, such as the smoke test above, are worth running in both places with different consequences.
What metrics show whether each approach is working?
On the left: commit-to-feedback time at median and p95, pre-merge failure rate, defects found by stage, flaky-test rate, escape rate. On the right: SLO attainment, error-budget burn, user-visible error rate and latency, incident frequency, canary rollback rate, failed deployment recovery time. Across both, use DORA's five delivery metrics at application or service level, read as a set rather than singled out. Source: DORA, read 19 September 2026.
What percentage of testing should shift left versus shift right?
There is no ratio worth quoting, and any number you see is a guess presented as a rule. Allocate checks by where the risk can be observed: reproducible risks go left, emergent ones go right. Then apply one constraint. Never use production evidence as a substitute for a cheap pre-merge check. If an incident had a reproducible case, that case belongs on the left from now on.